Voltage

Bioelectric Signal Acquisition

Action Potential in Plants

Action Potential in Plants

Plants lack a nervous system, yet they communicate through electrical signals. Their cells generate action potentials, just like animal neurons, enabling rapid, coordinated responses to environmental stimuli.

More Information
Event Molecules / Ions Involved Type of Process
Stimulus Sensory mechanisms Channel opening
Ca2+ influx, K+ and Cl− efflux Ions Passive diffusion
Depolarization — Action potential
Potential restoration ATP, H+ pumps, ion exchangers Active transport
Action Potential in Plant Cell

Action Potential in Plants

Plants' cells generate action potentials strikingly similar to those of animal neurons, enabling rapid and coordinated responses to environmental stimuli. This process is driven by calcium, chloride, and potassium ions: when calcium concentration exceeds a critical threshold, depolarization propagates from cell to cell without direct energy consumption, following the electrochemical gradient.

Specialized intercellular structures, analogous to animal synapses, ensure efficient transmission of information throughout the organism. Reactive oxygen species, produced by redox reactions, further amplify the electrical signal. Remarkably, glutamate (the primary neurotransmitter in animal nervous systems) performs the same function in plants, activating calcium channels and coordinating responses across the entire organism.
Bioelectric Reaction

Mathematical Analysis & Automatic Fitting for Voltage Signals

A dedicated analysis module allows quantitative characterization of plant electrical signals:

Automatic Signal Classification

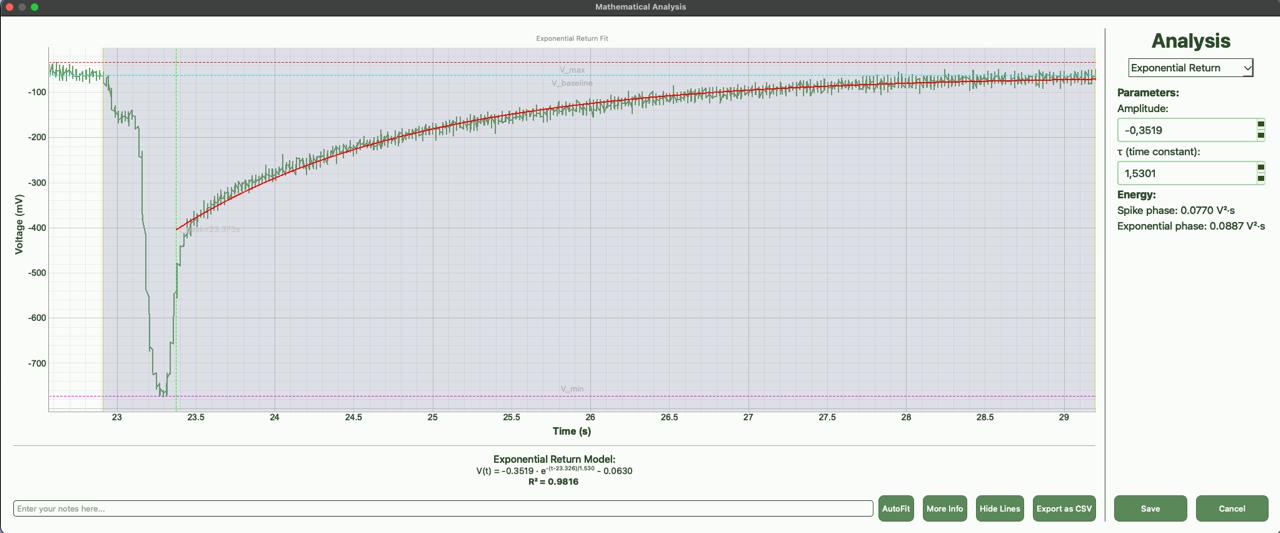
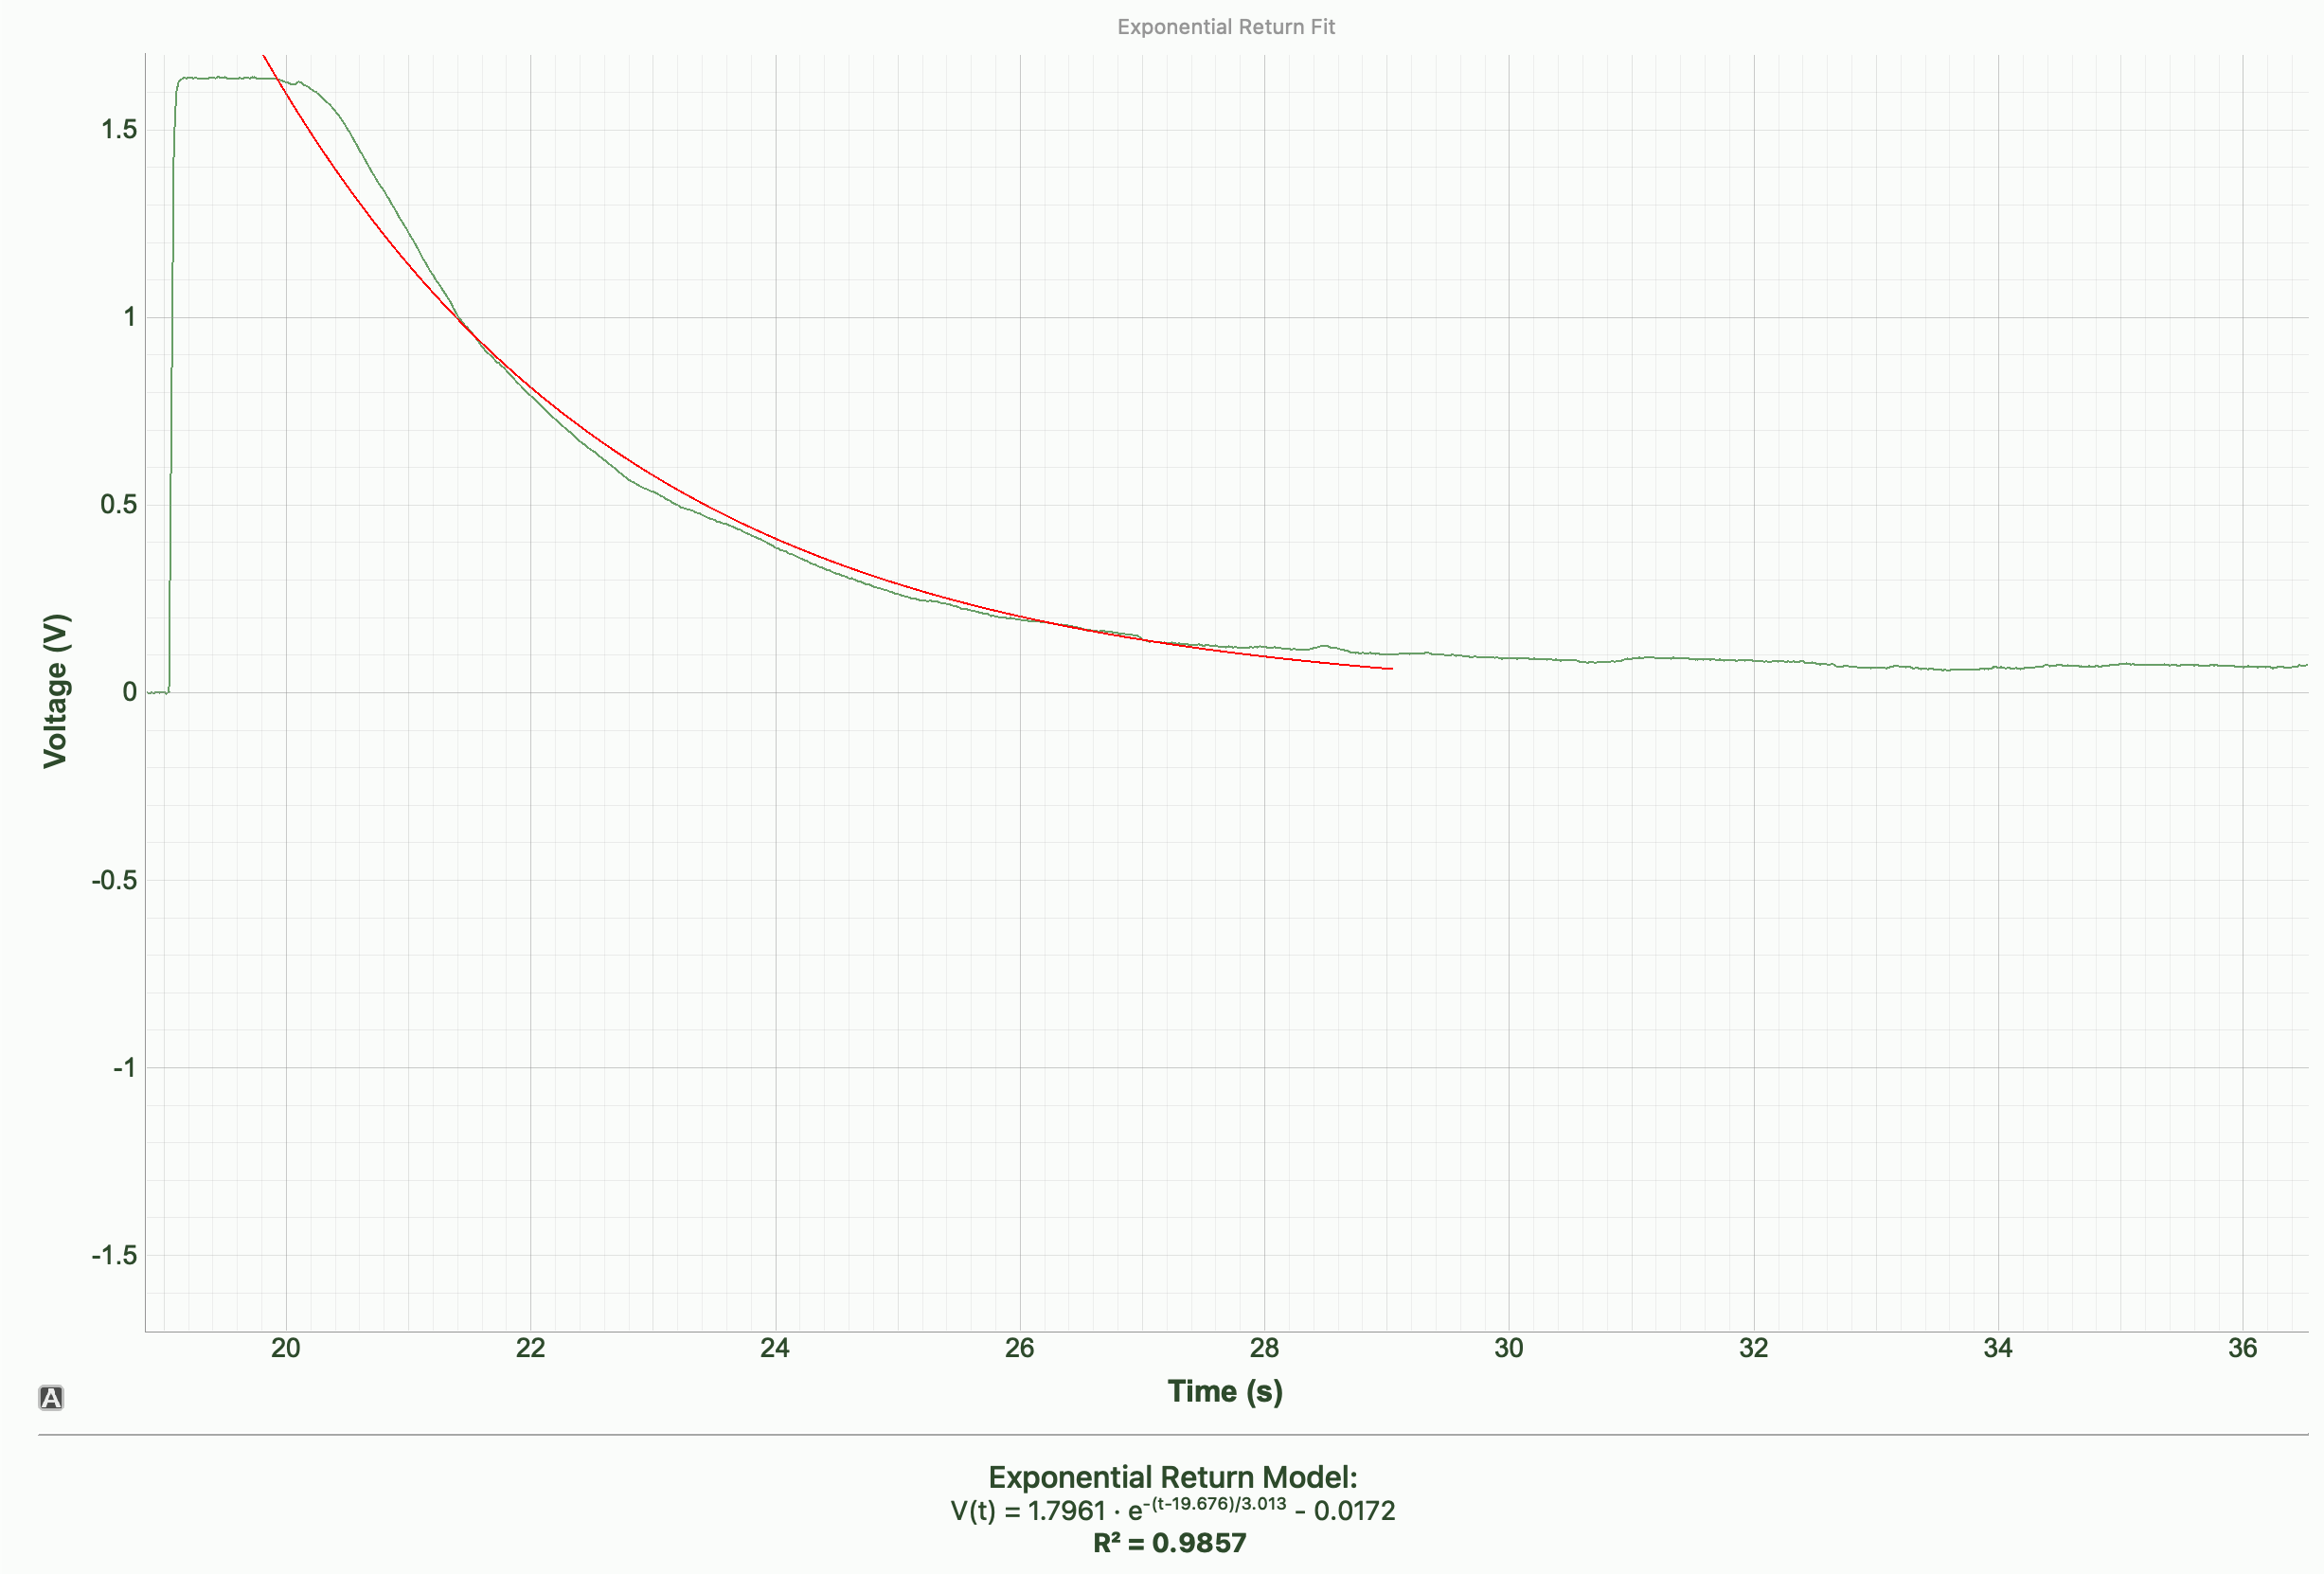
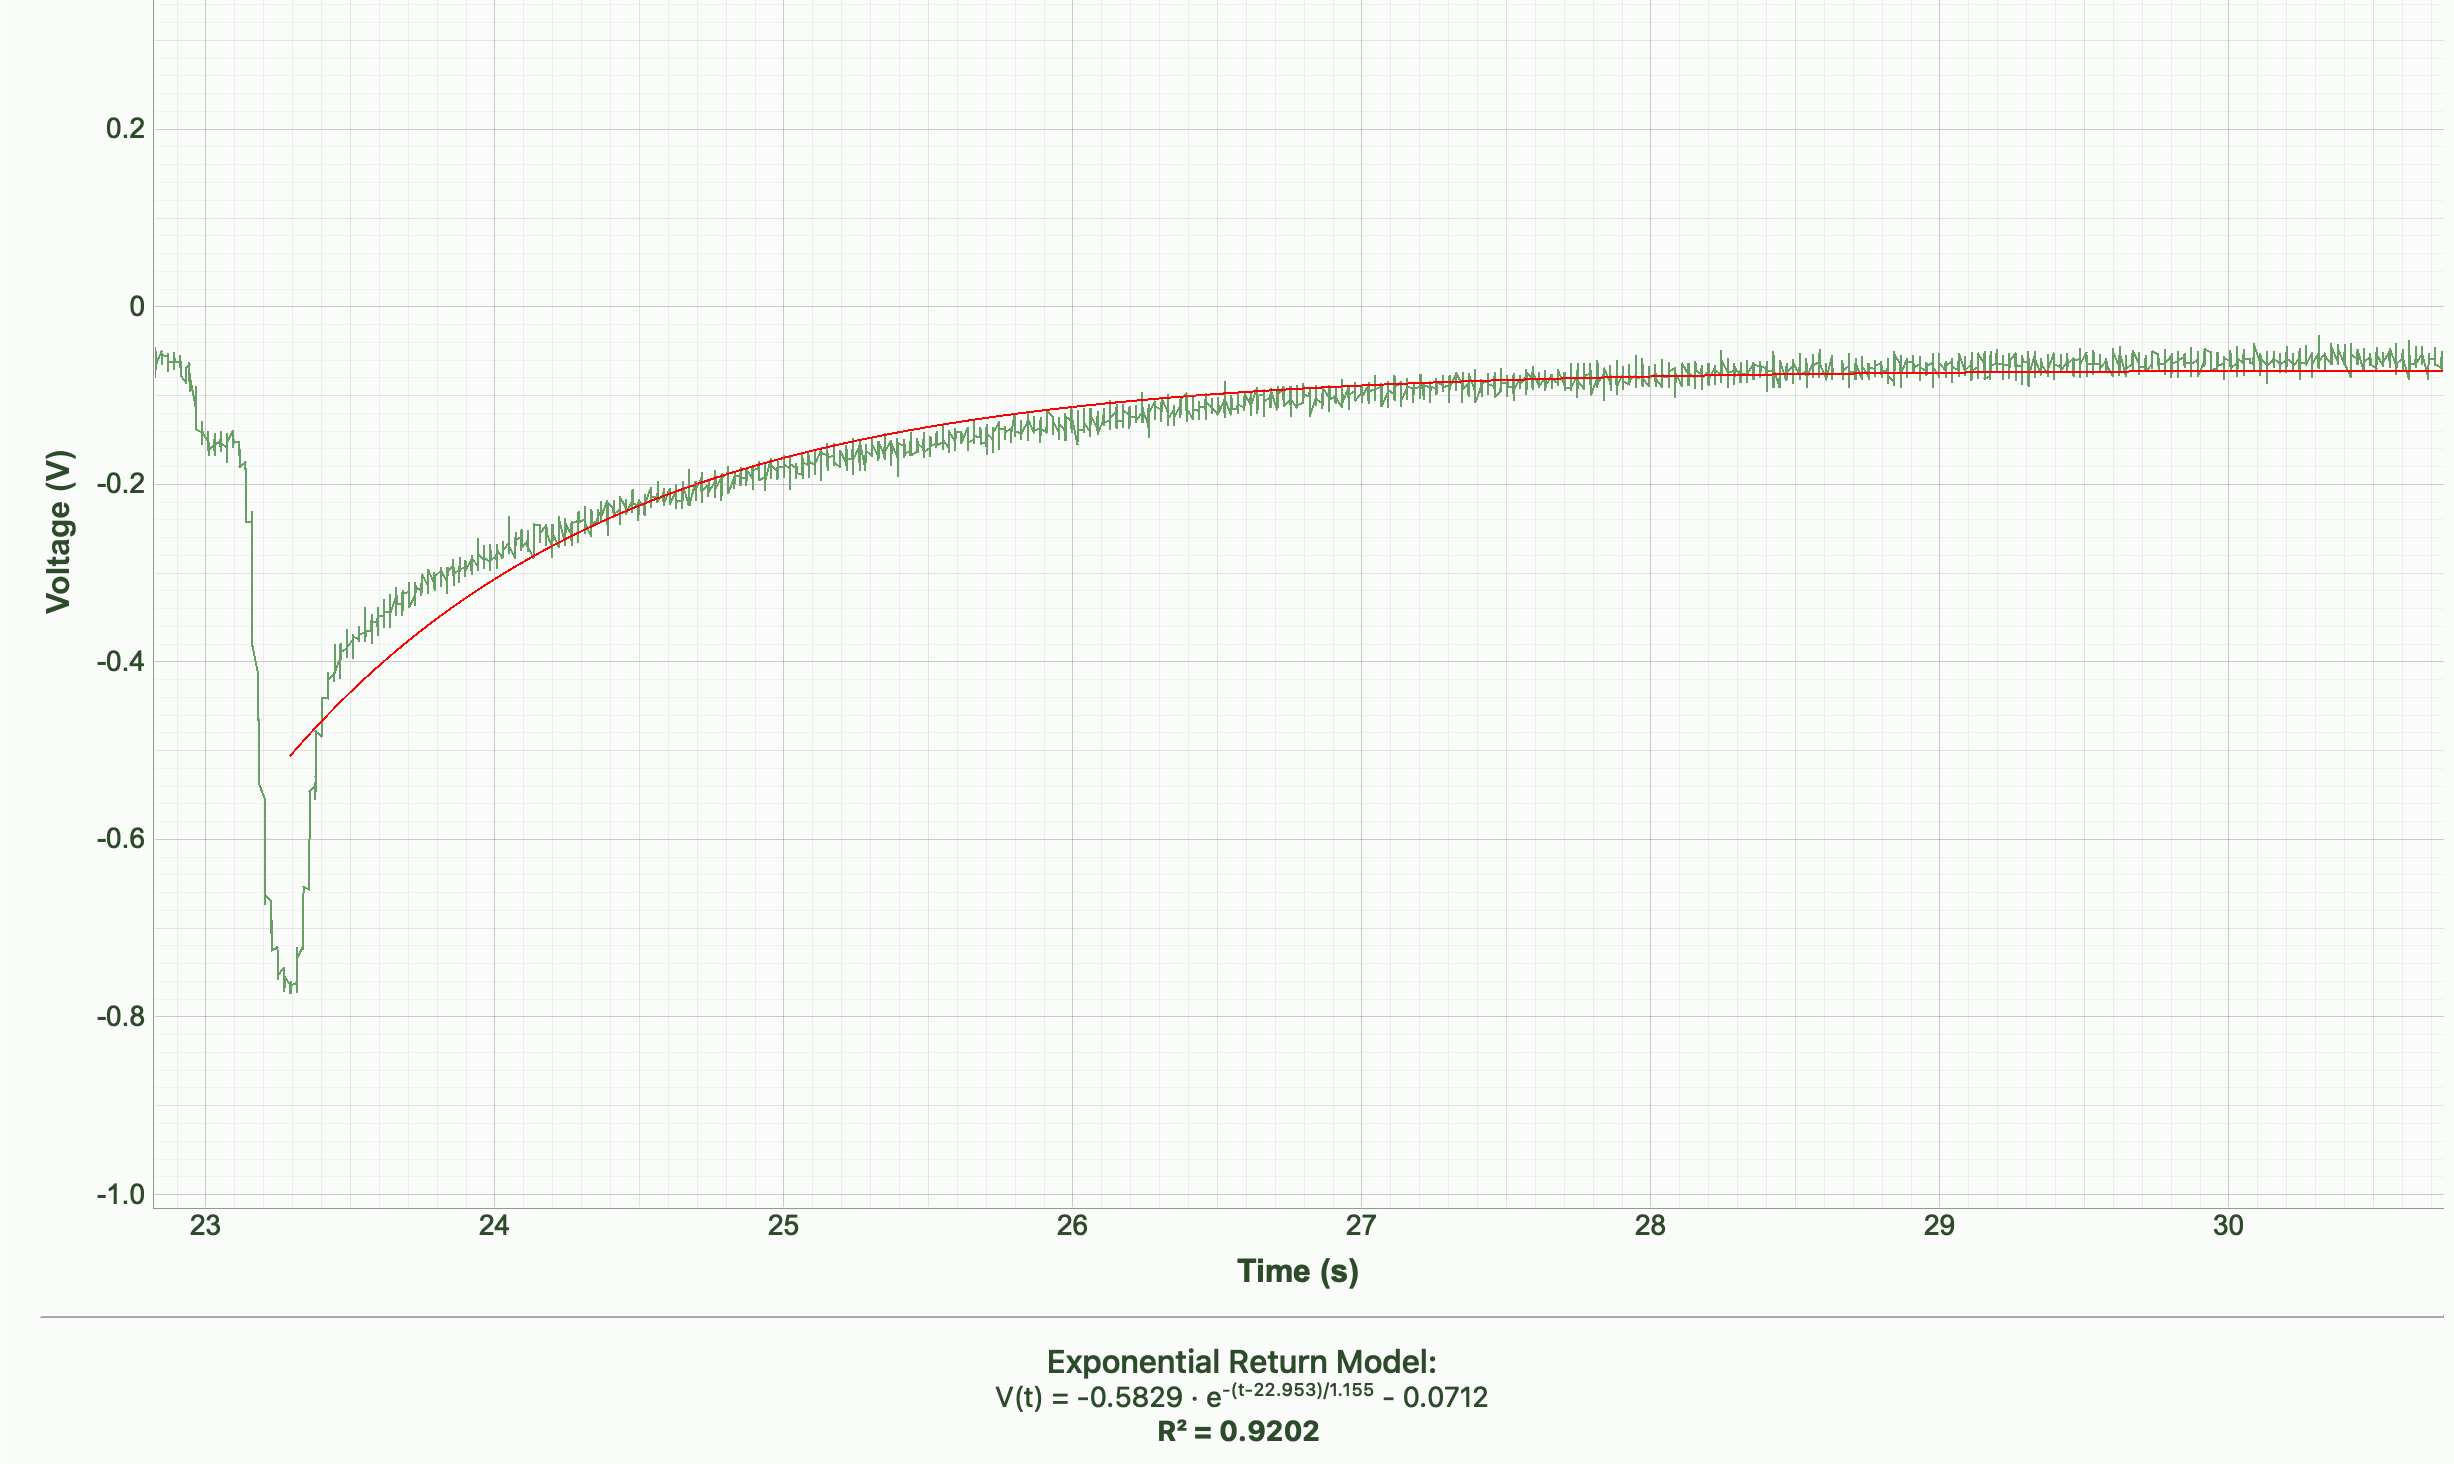
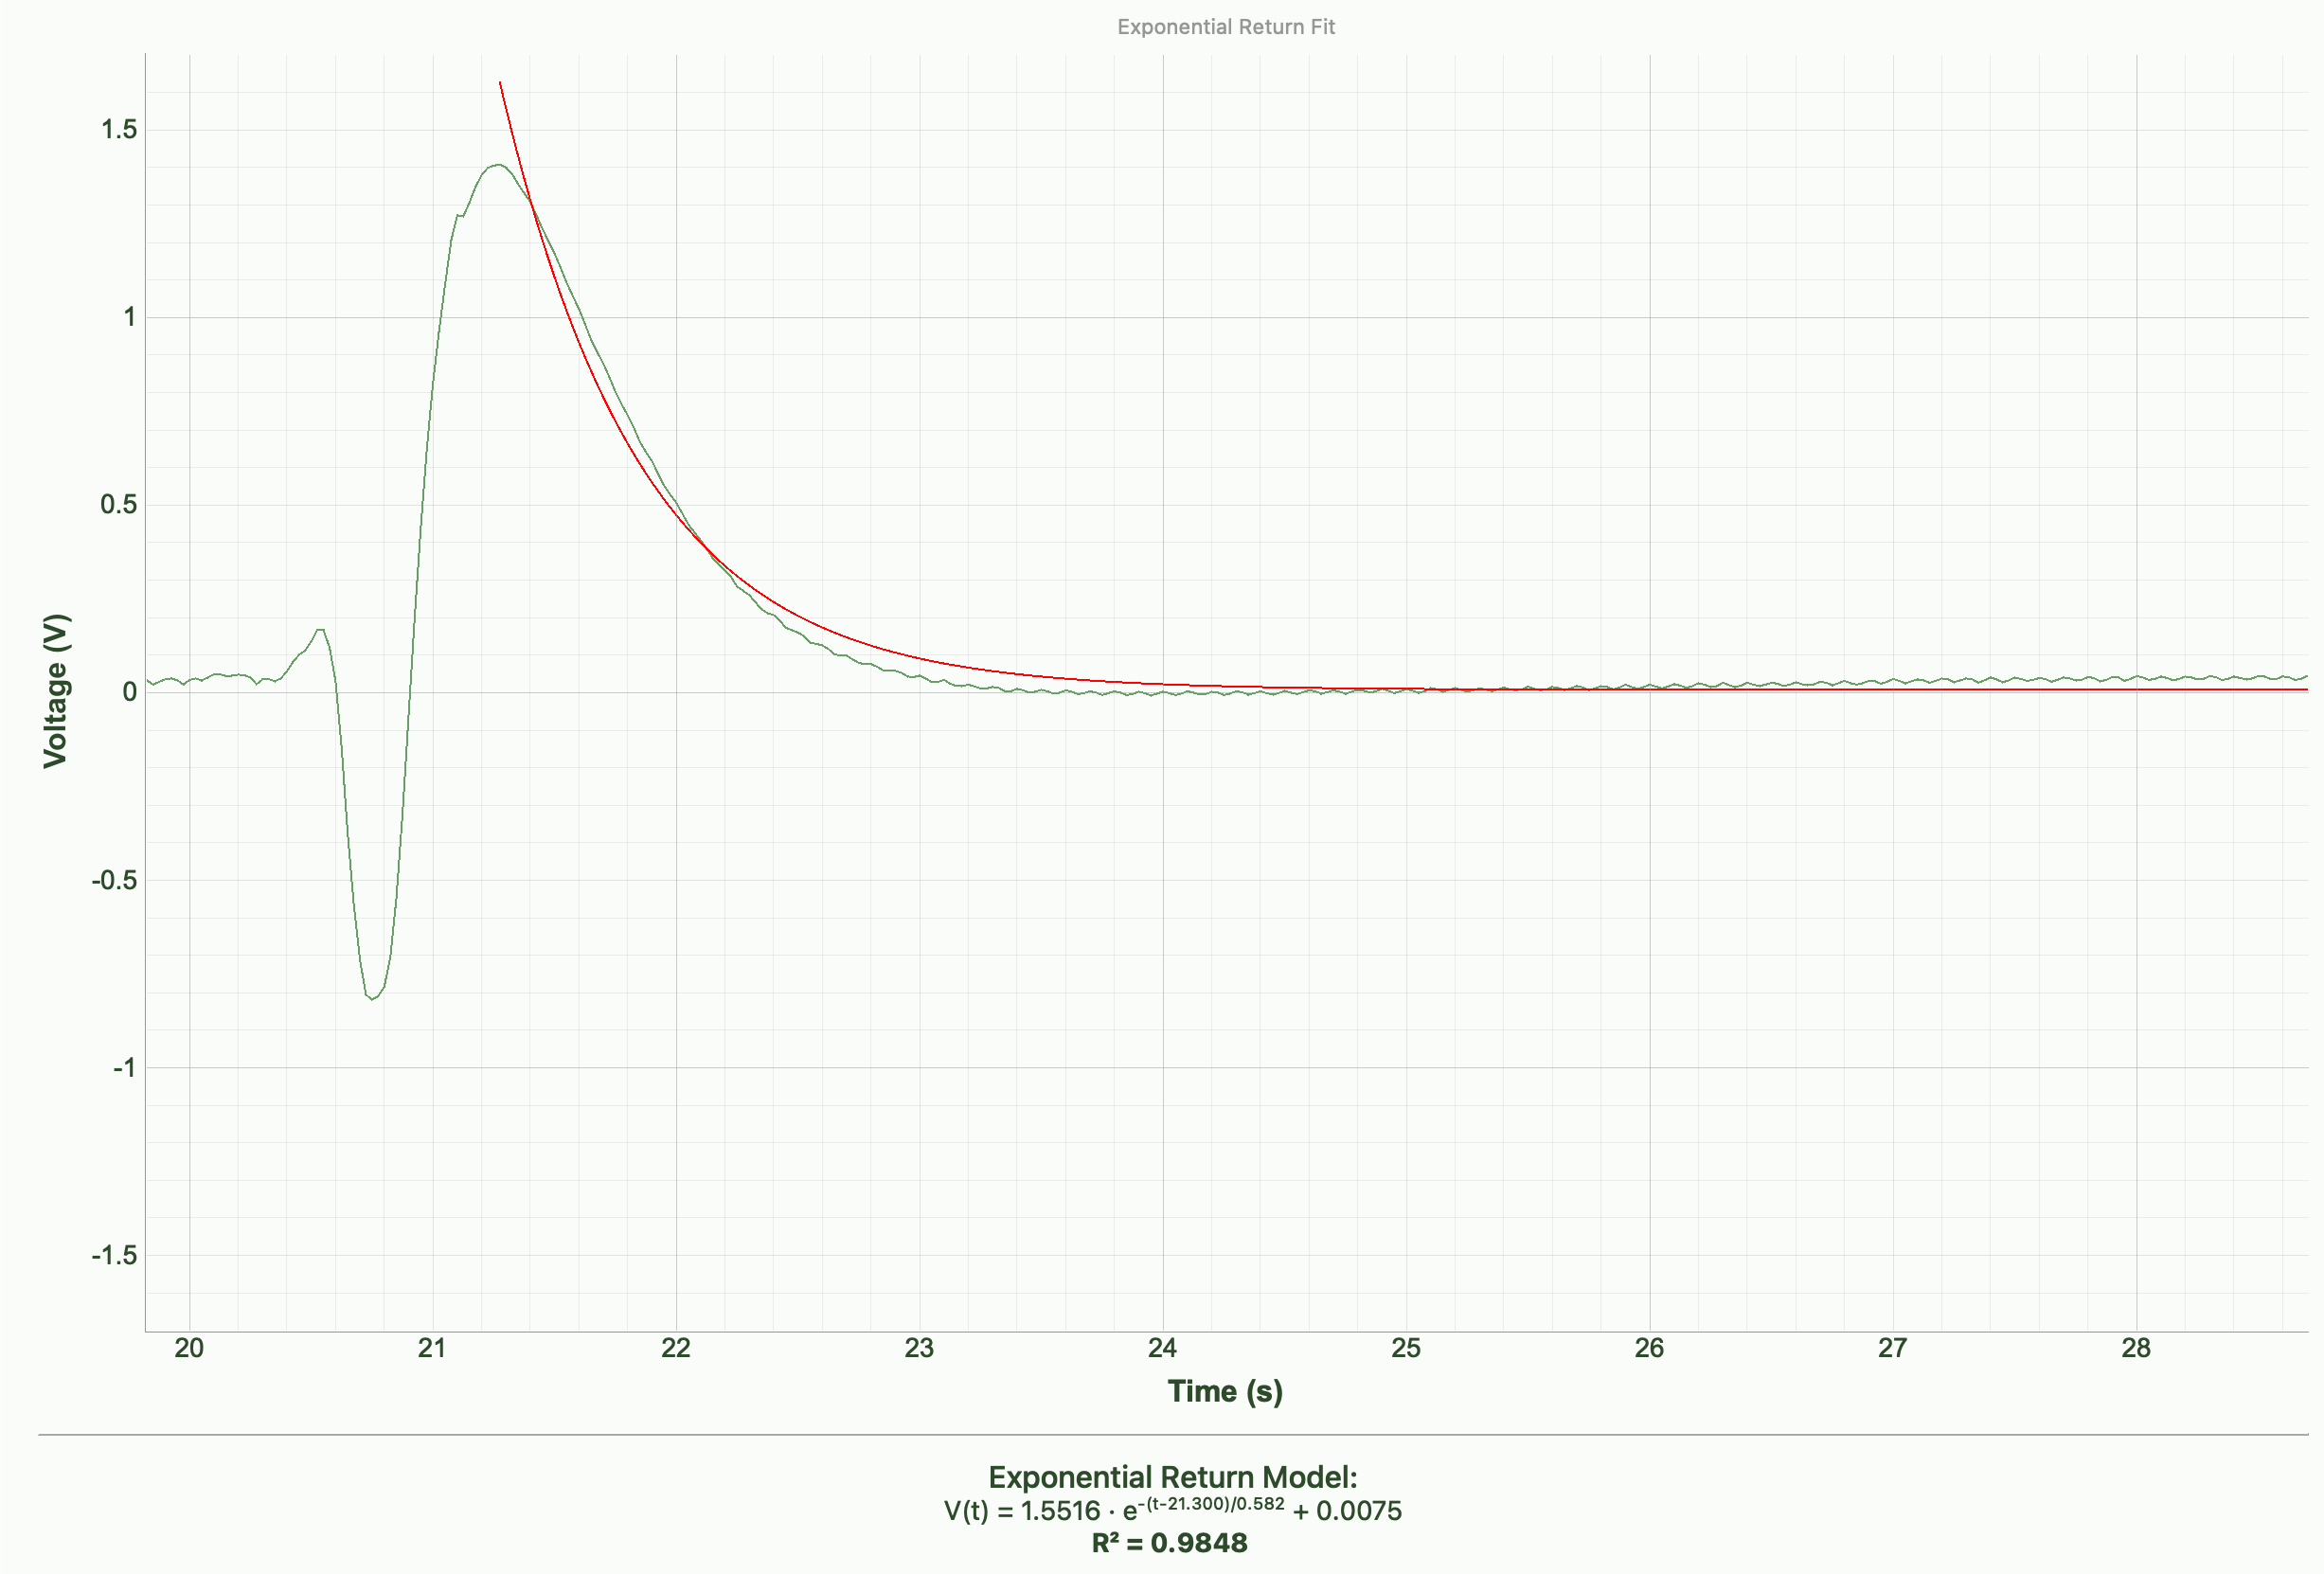
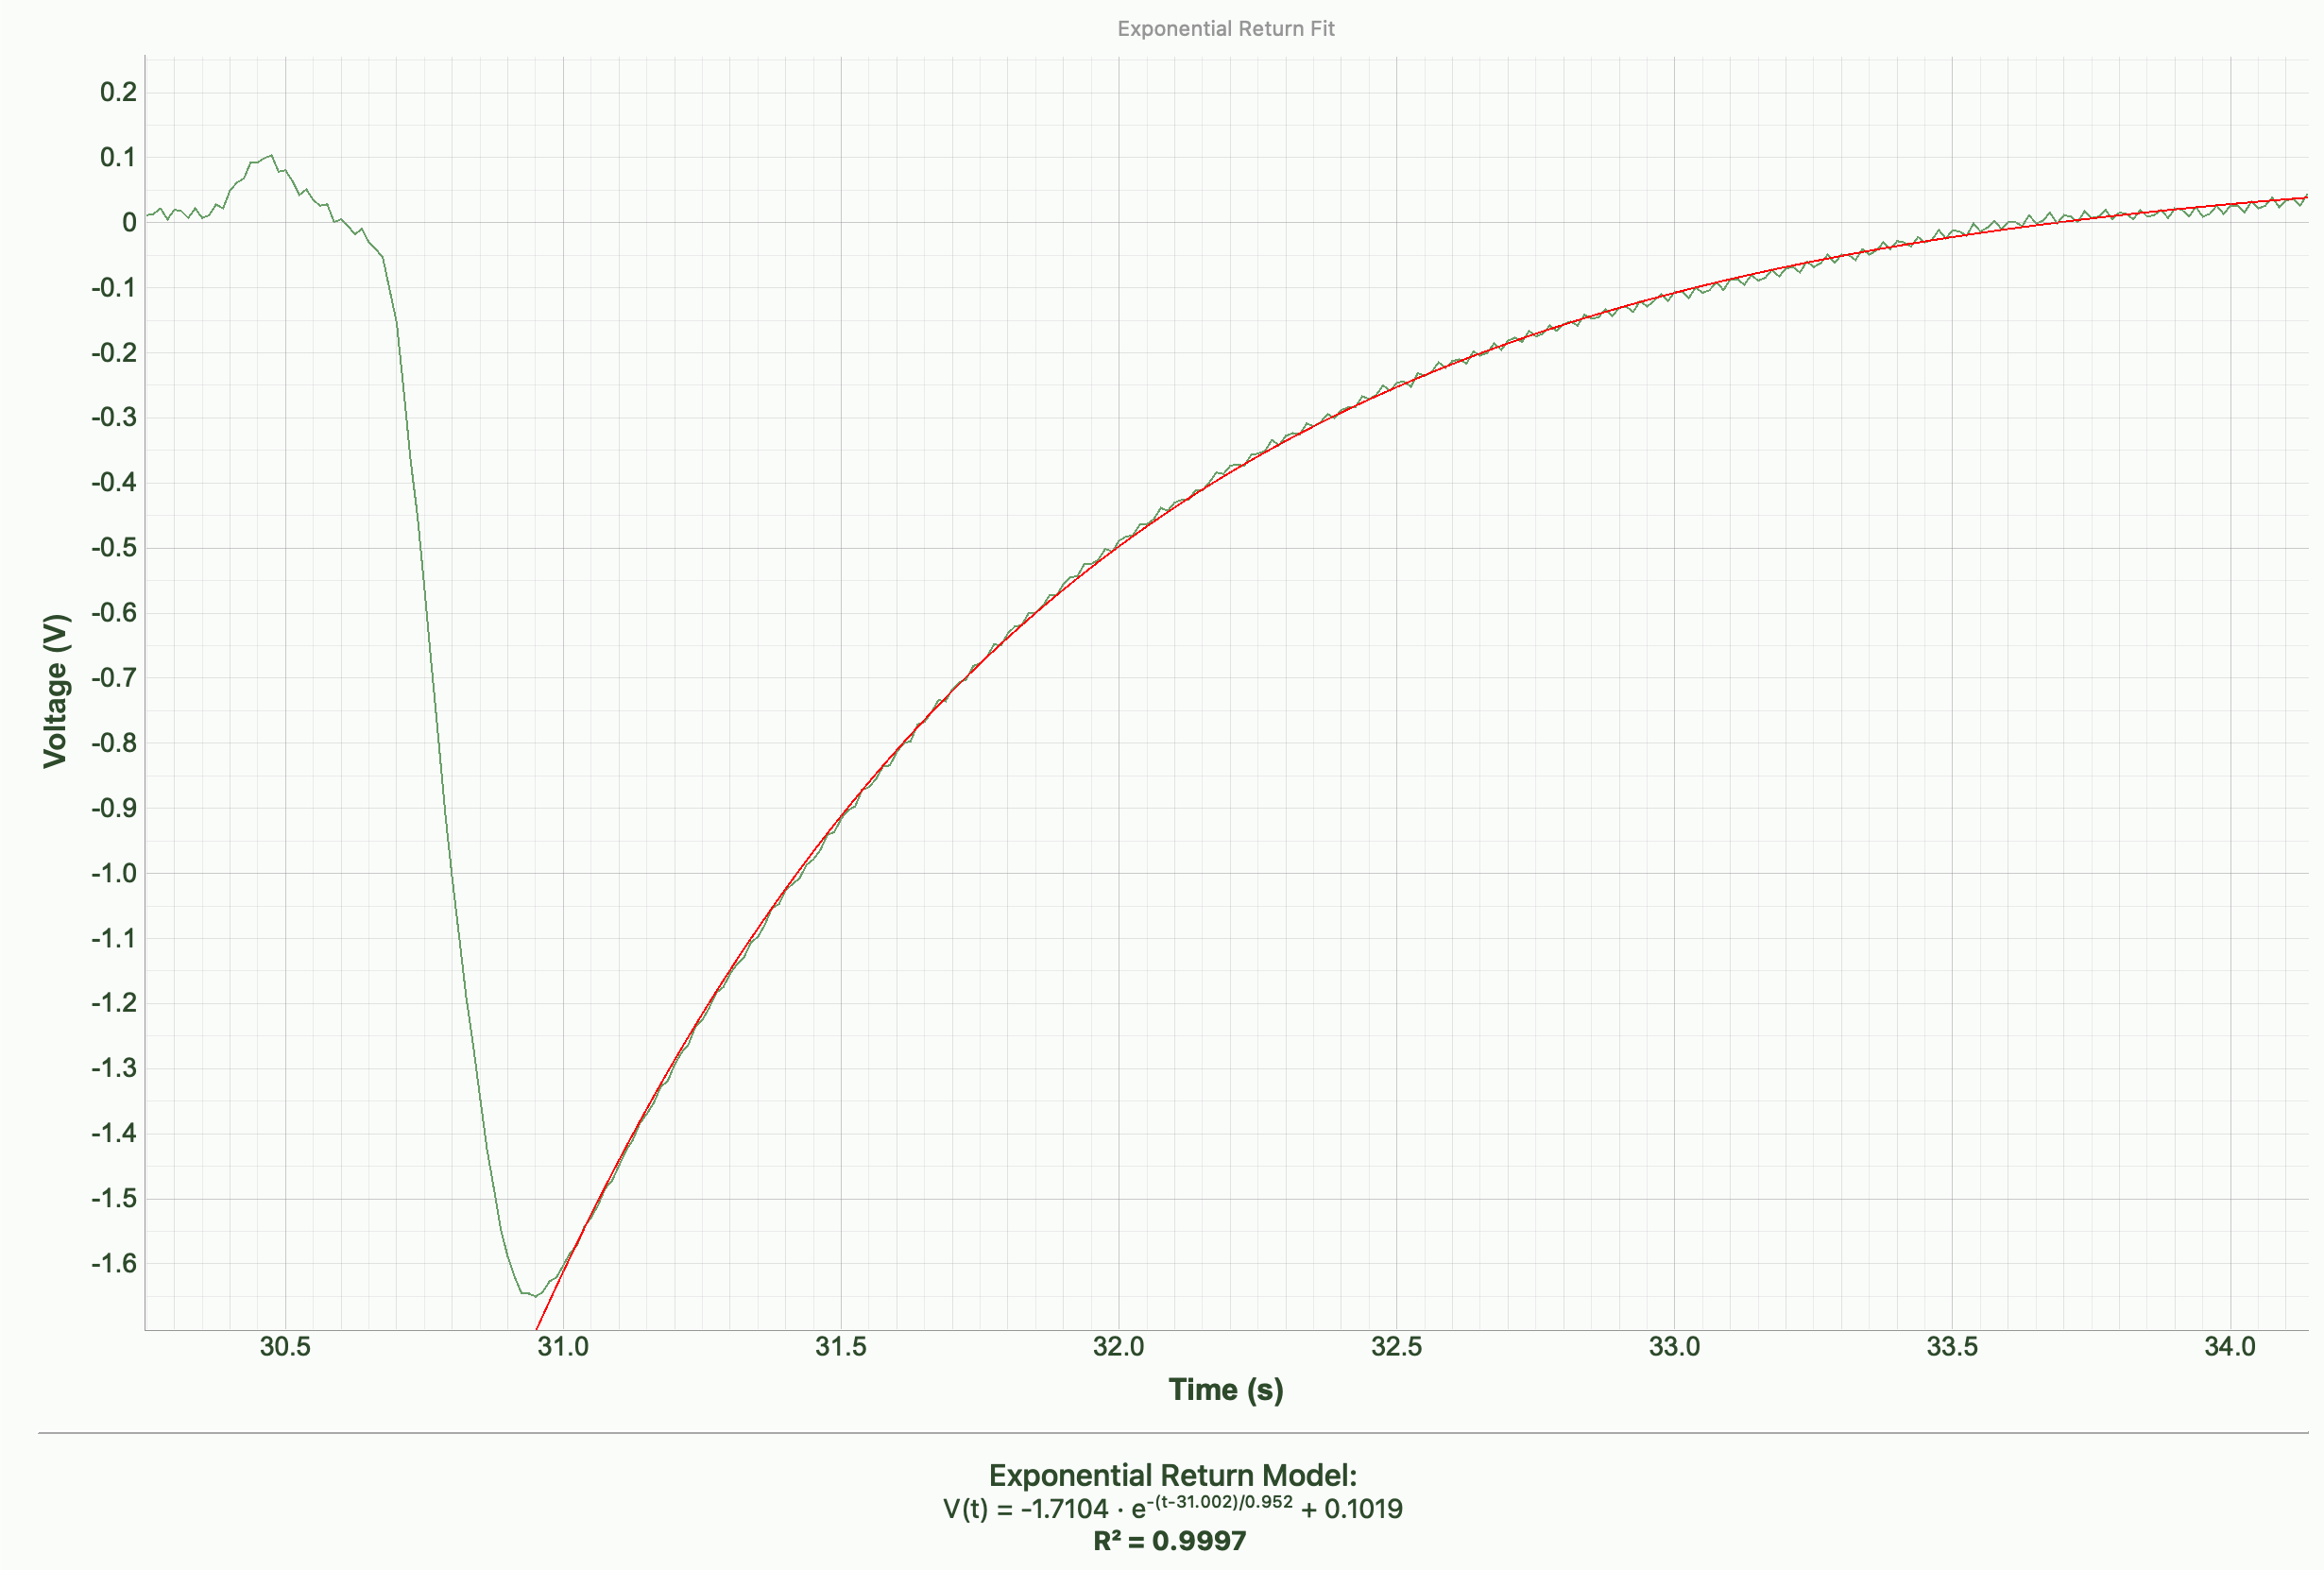
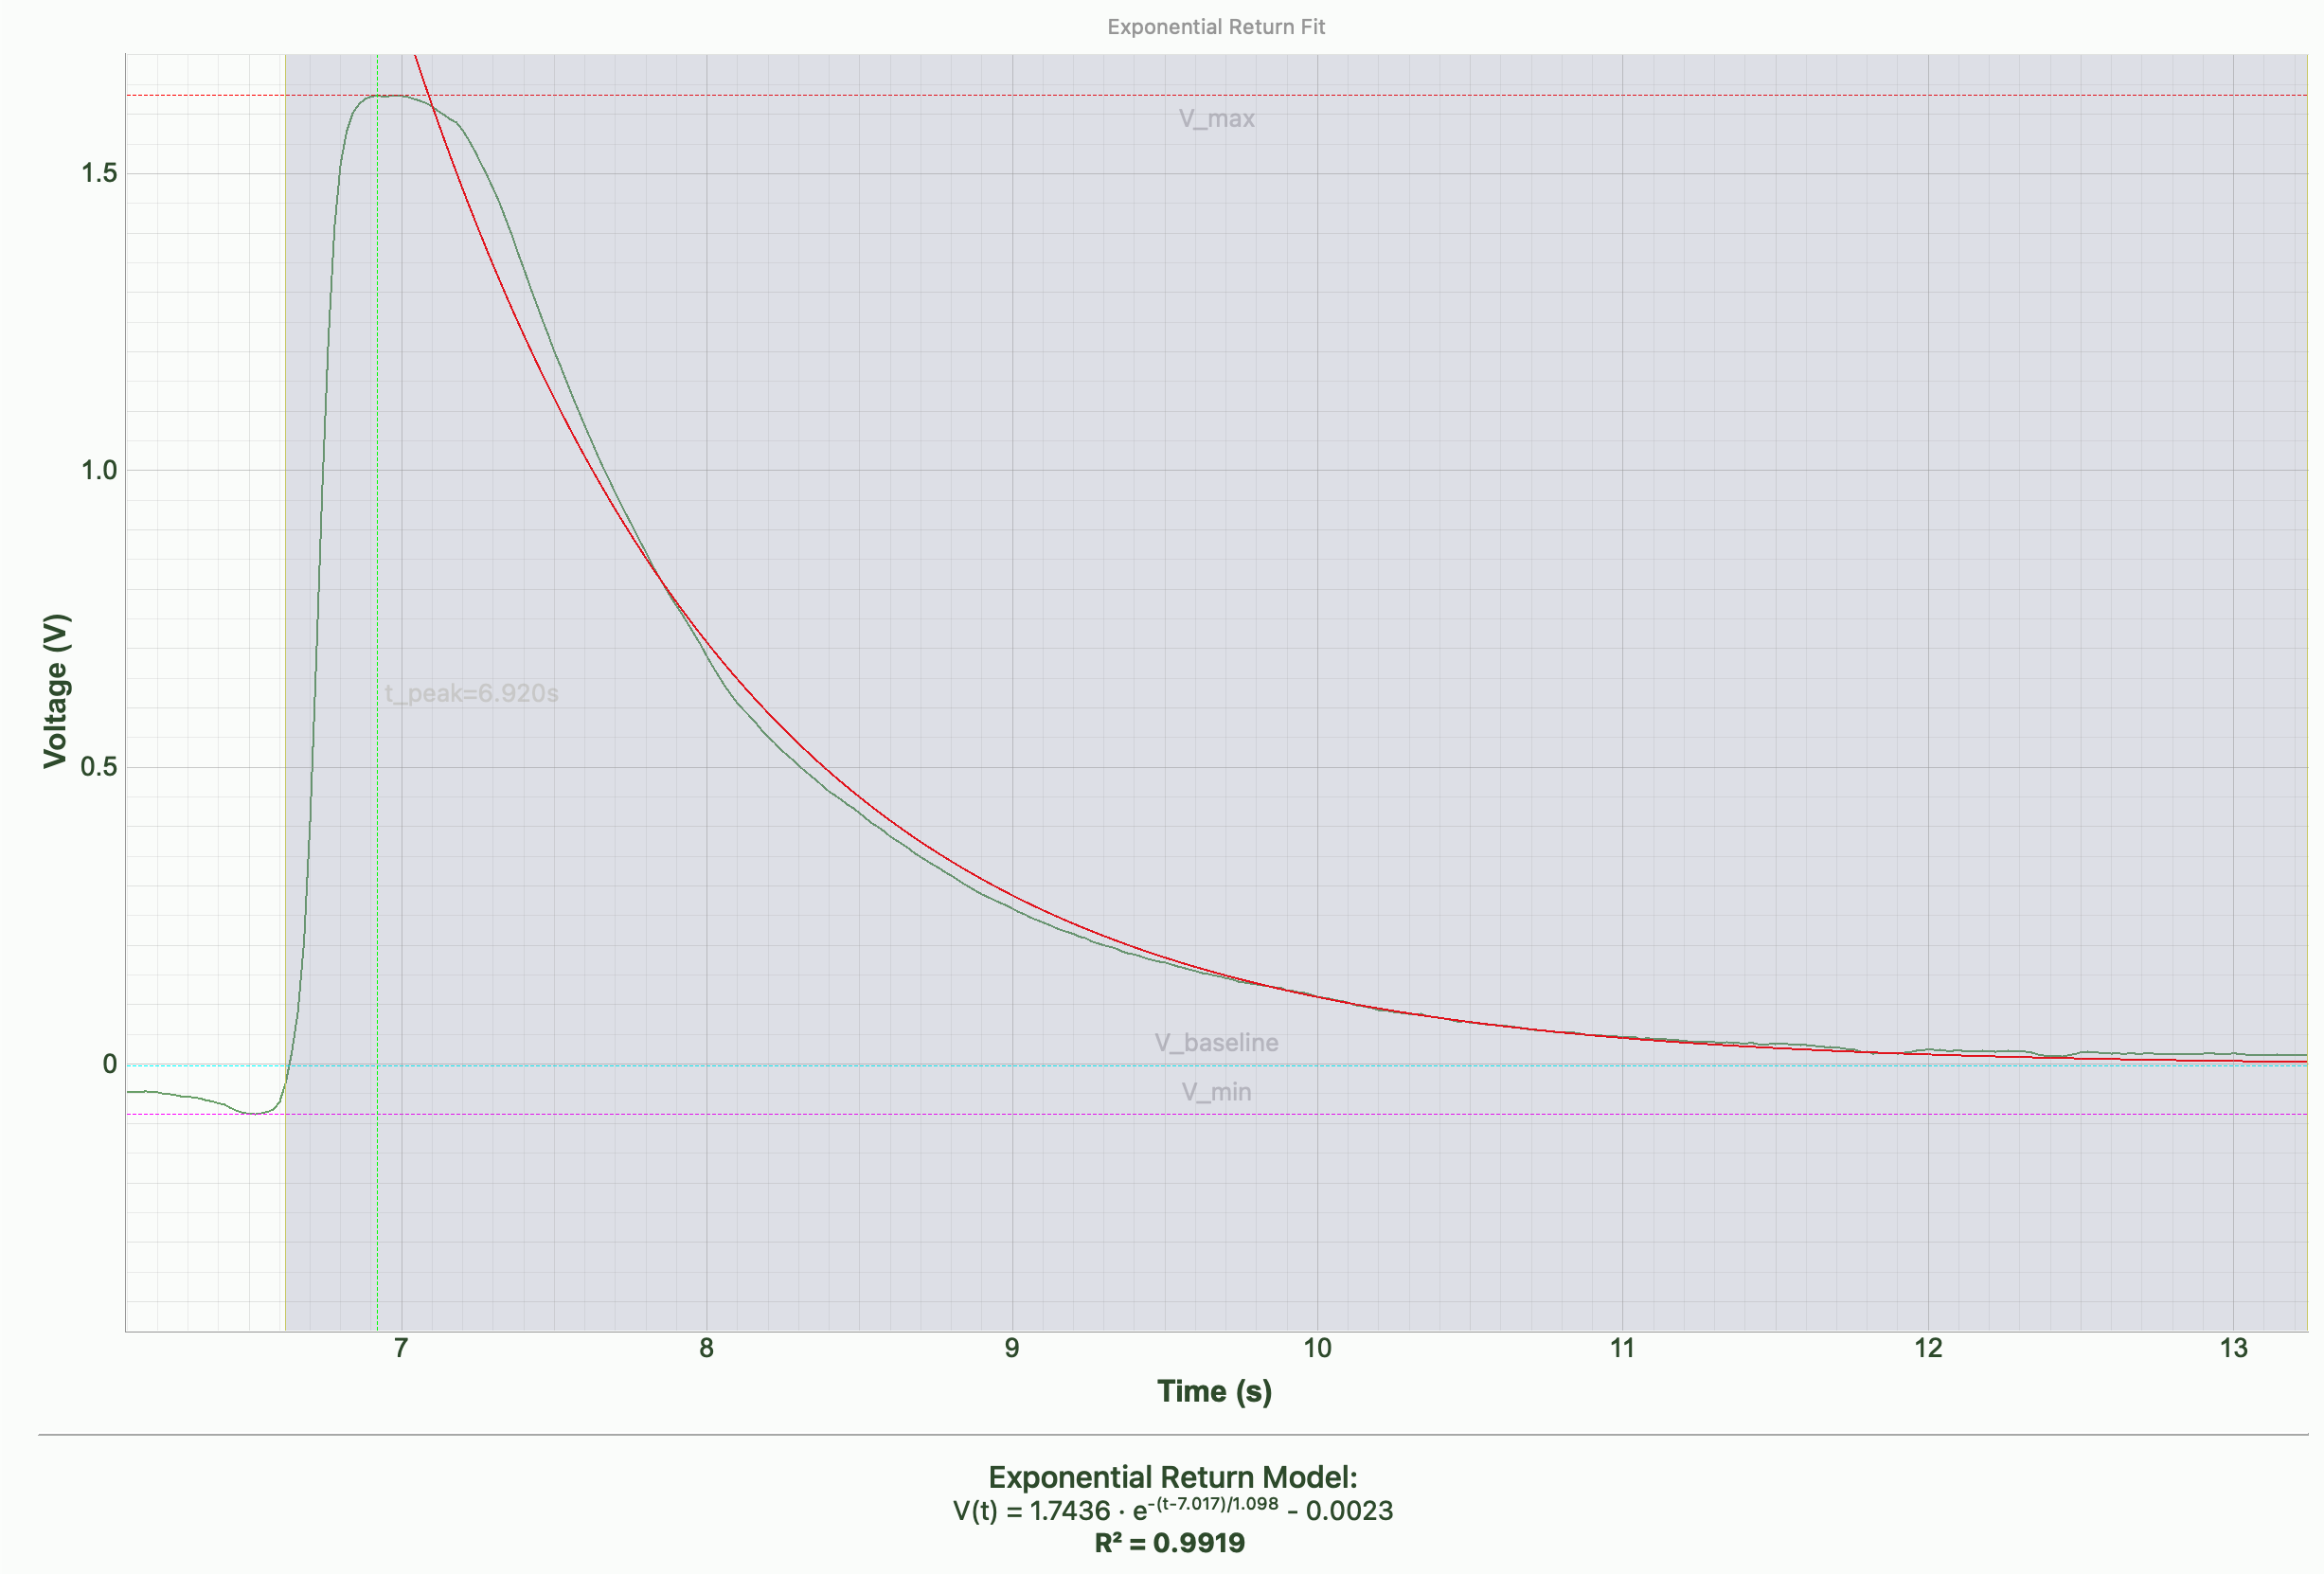
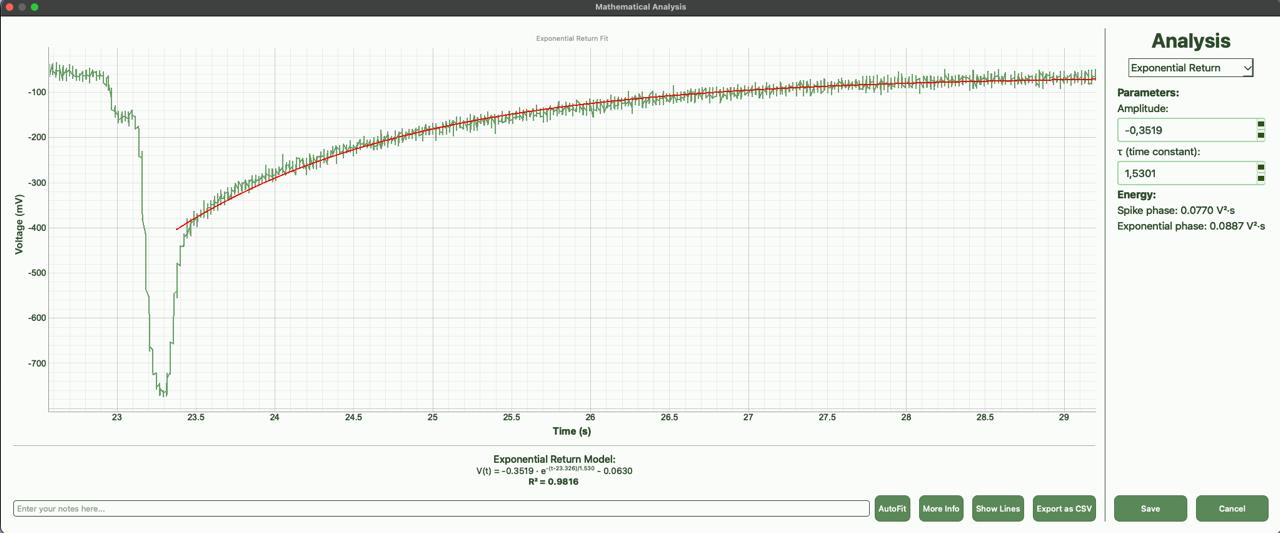
Exponential Return Model

Exponential Return More Information

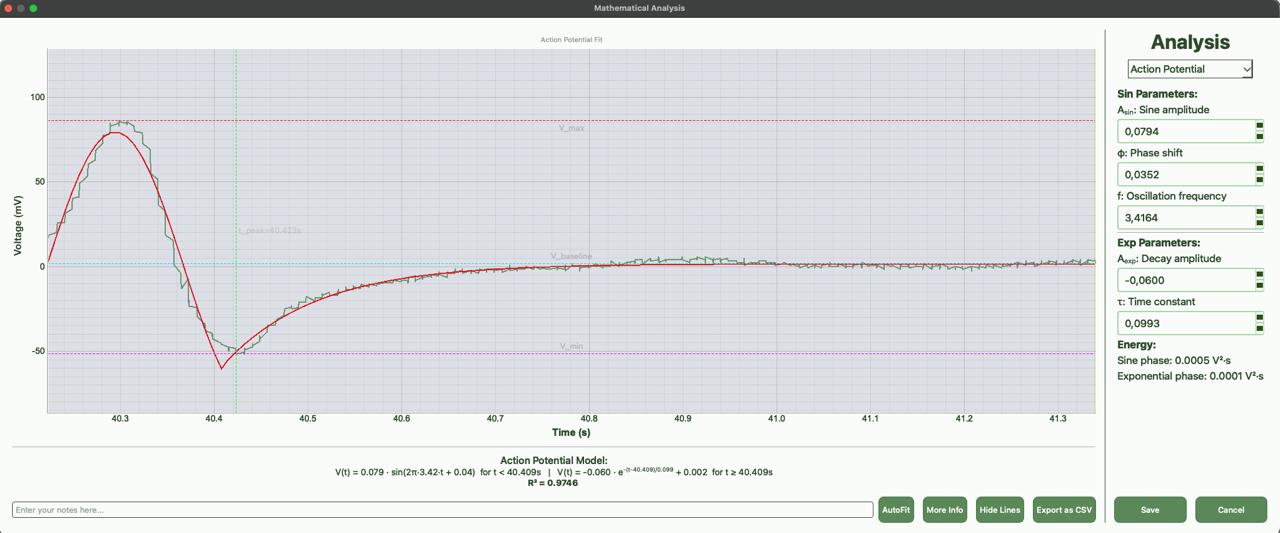
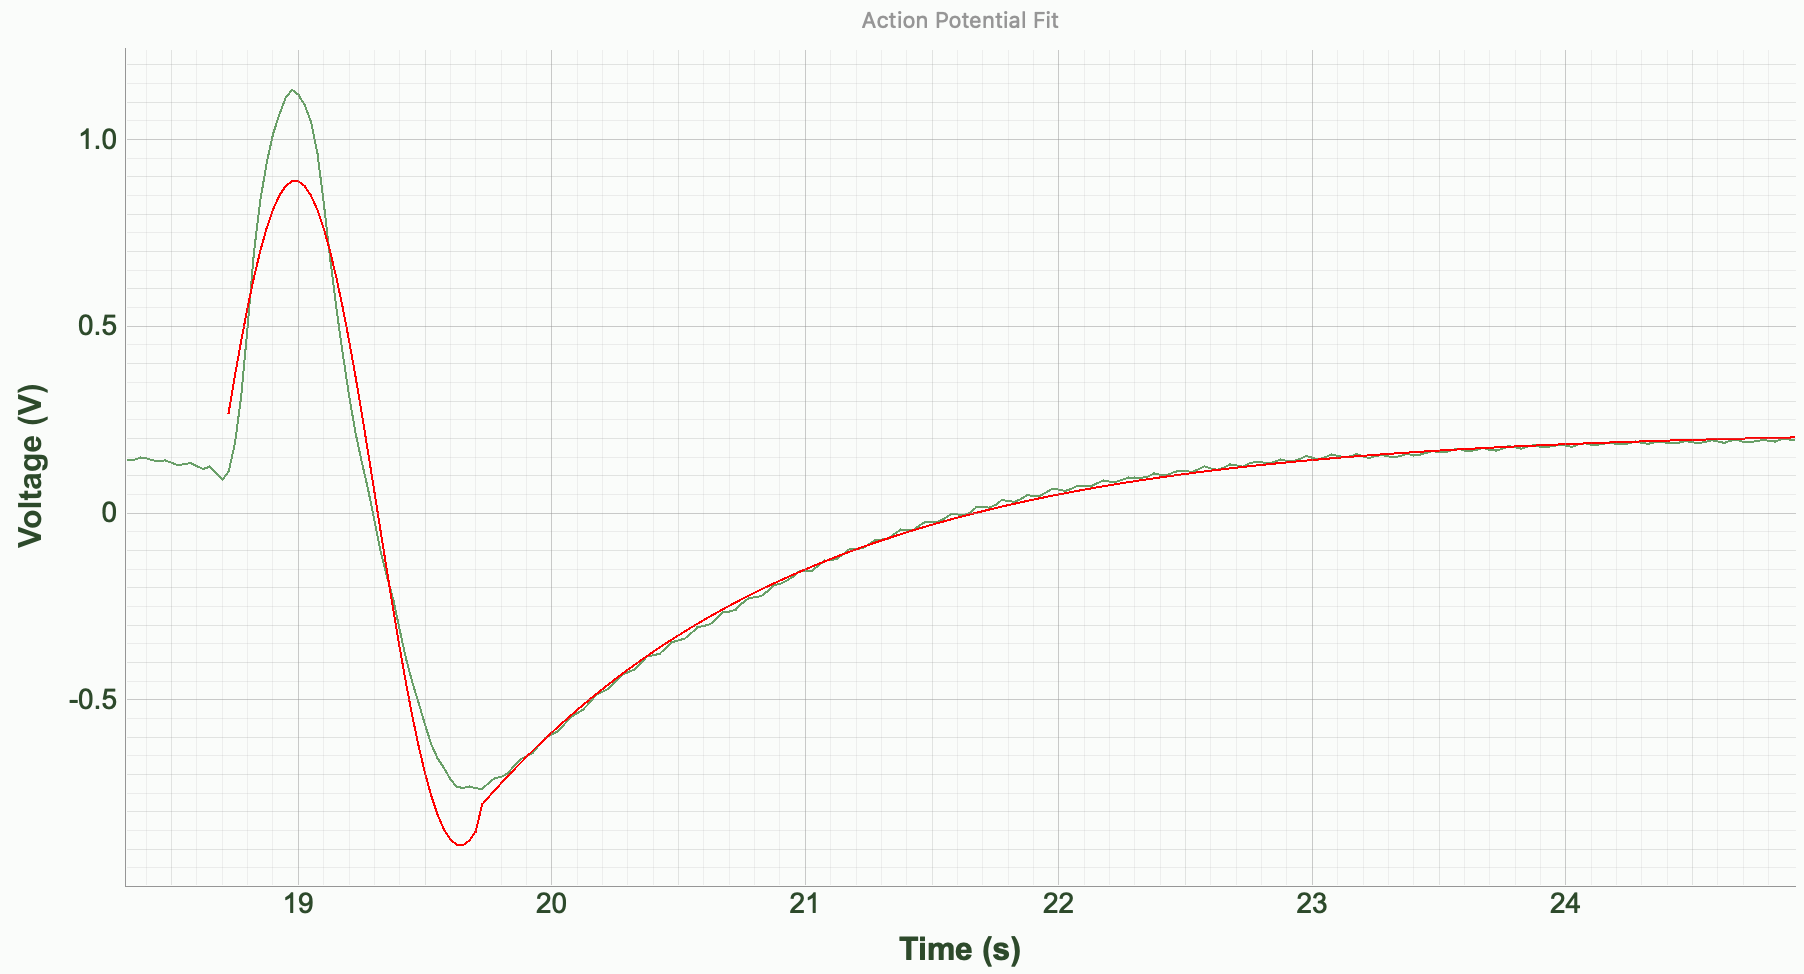
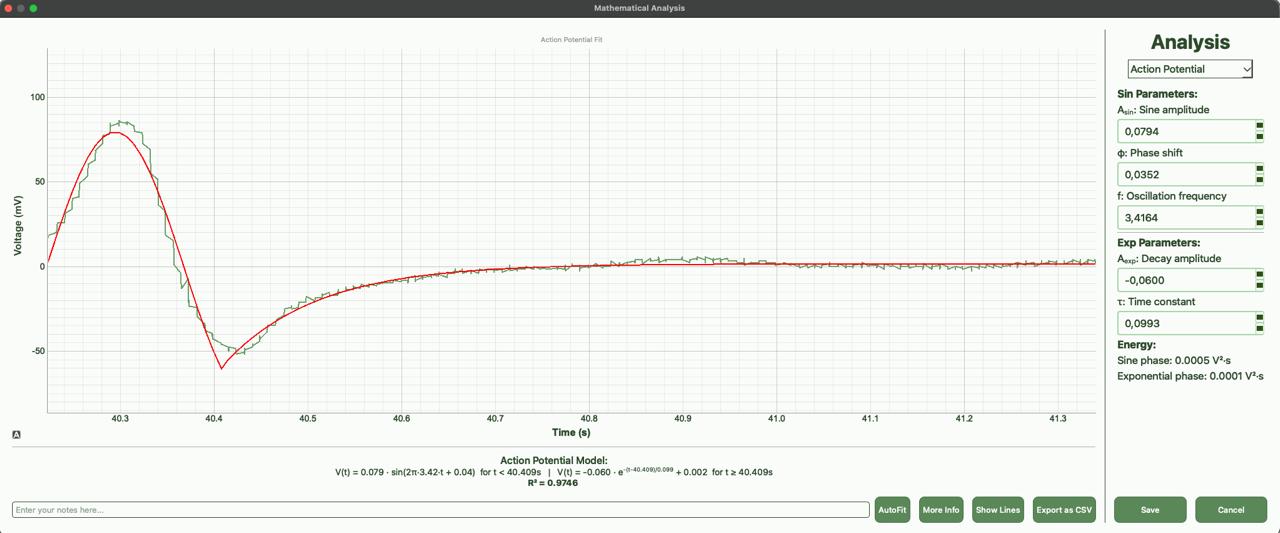
Action Potential Model

Action Potential Model More Information

Analysis

Fitted to the decay phase from the peak:

\[ V(t) = A \cdot e^{-\,(t - t_0)\,/\,\tau} + V_{\text{baseline}} \]

  • Extracts: amplitude A, time constant τ, peak time t₀, baseline V_baseline
  • Physical meaning: membrane relaxation after mechanical/hydraulic stimulus
Exponential Return Model

Analysis

A physiologically motivated two-phase model:

\[\begin{aligned} V(t) &= A_{\text{sin}} \cdot \sin\!\bigl(2\pi f\,(t - t_0) + \varphi\bigr) && \text{for } t < t_{\text{peak}} \quad [\text{depolarization}] \\[6pt] V(t) &= A_{\text{exp}} \cdot e^{-\,(t - t_{\text{peak}})\,/\,\tau} + V_b && \text{for } t \geq t_{\text{peak}} \quad [\text{repolarization}] \end{aligned}\]
  • Extracts: 7 parameters (amplitude, frequency, phase, time constant, baseline)
  • Physical meaning: fast oscillatory depolarization + exponential repolarization
Action Potential Model
Voltage Instrumentation

Voltage Instrumentation

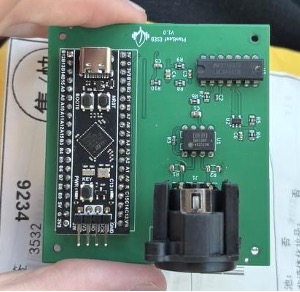
The system evolved from a manually assembled prototype with discrete components to a compact dedicated PCB. This transition improved reliability, reduced size and noise, and allowed the integration of signal acquisition, processing, and communication into a single board.

More Information Full Hardware Report on GitHub
PlantLeaf ESEB V1.0 PCB 3D

Voltage Instrumentation

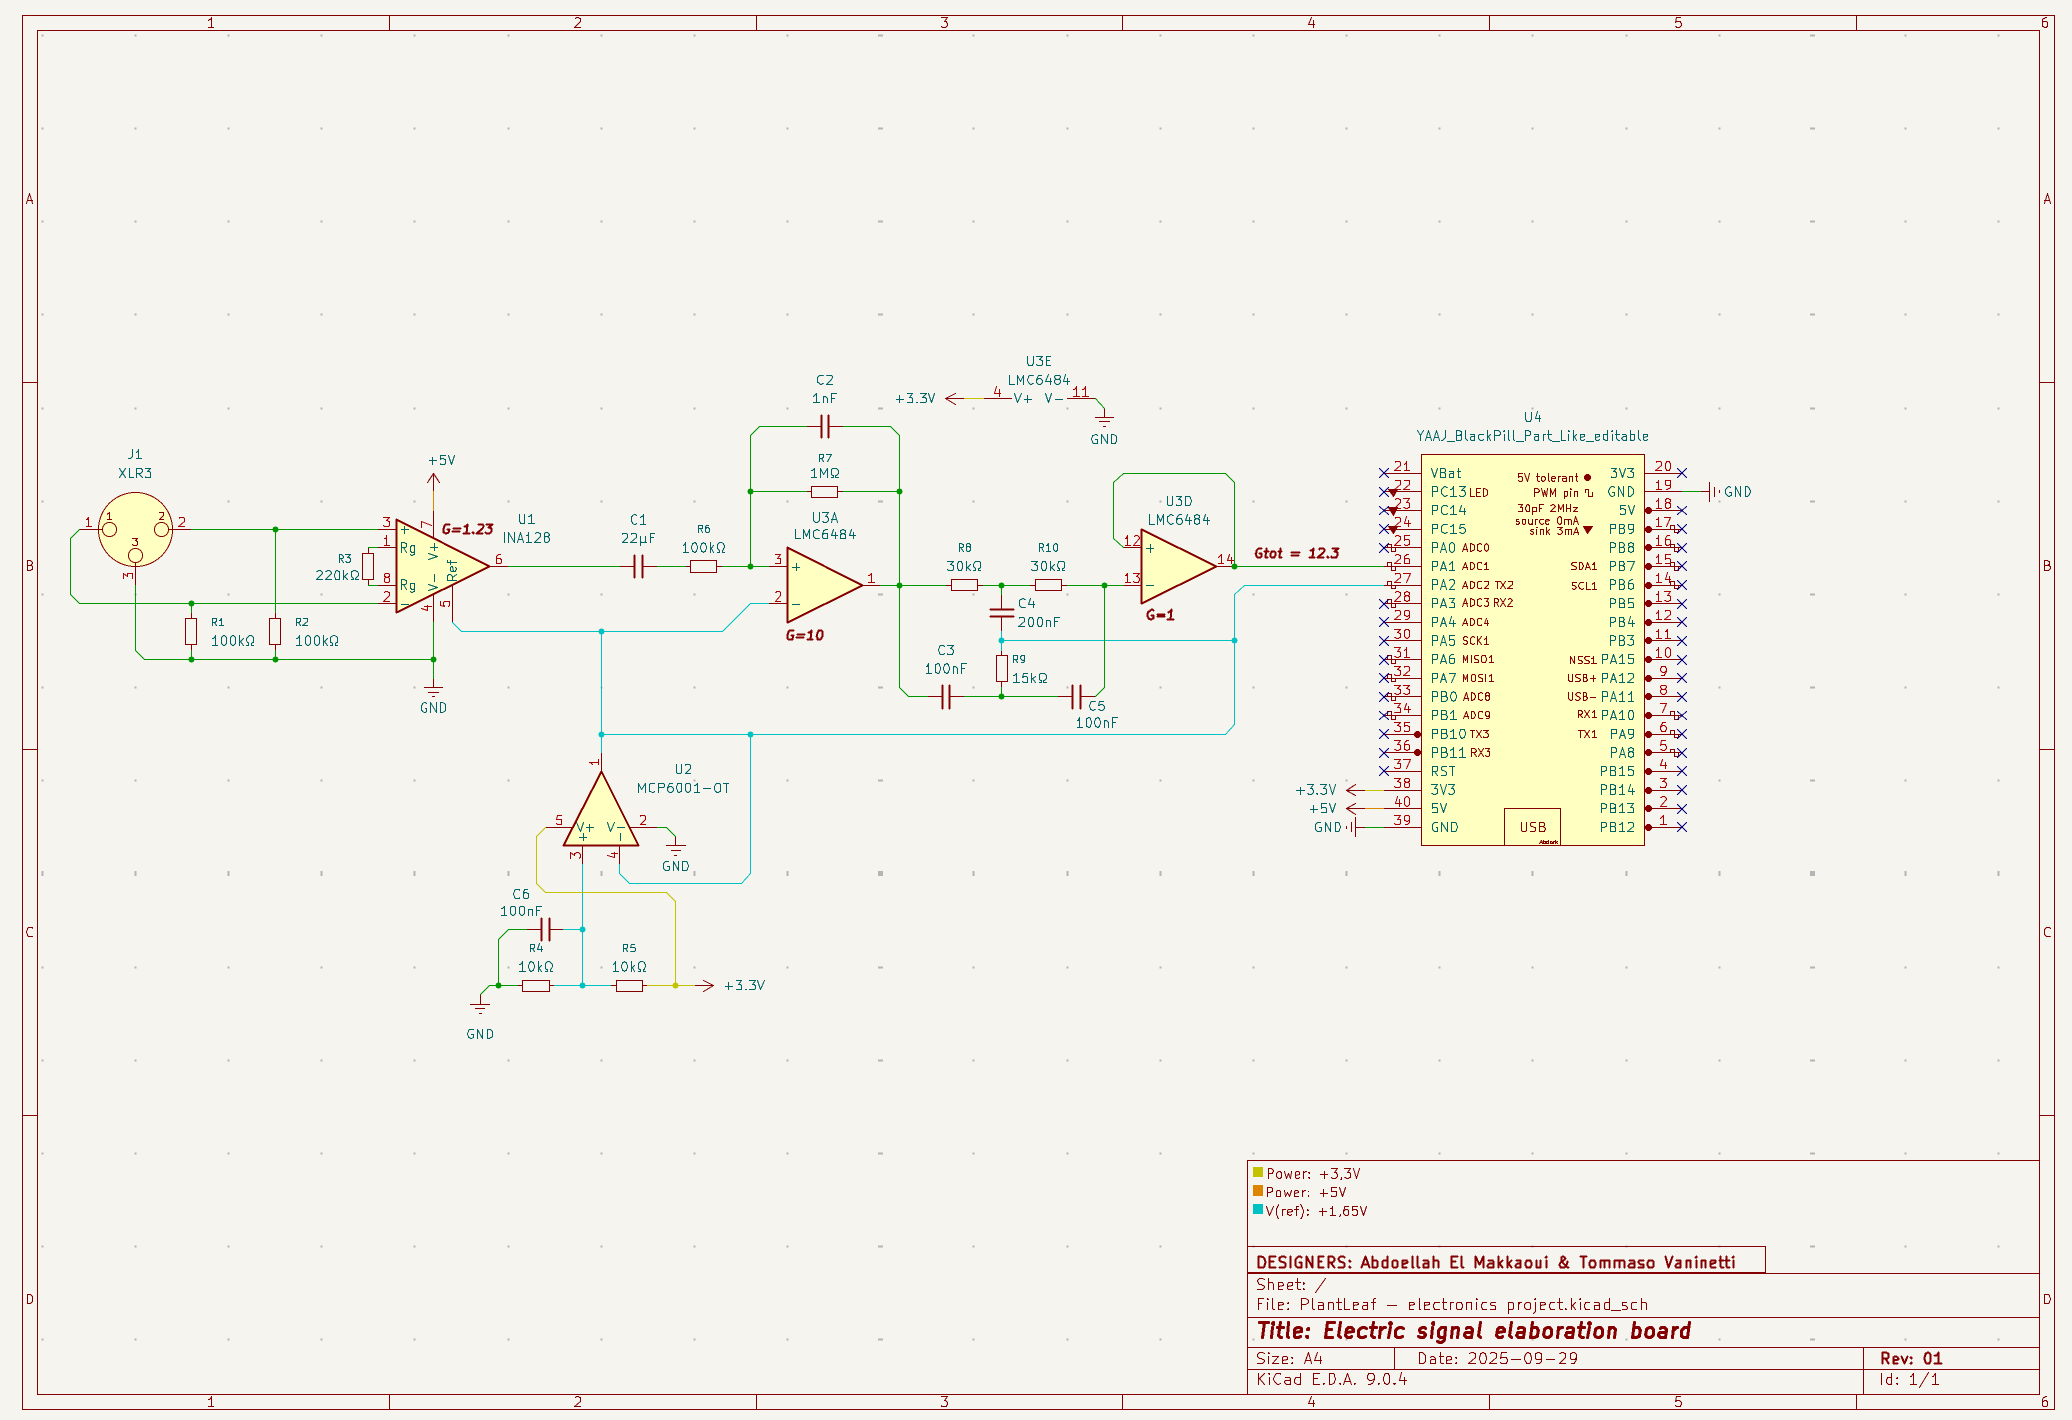
The PlantLeaf ESEB V1.0 is a custom PCB designed with KiCad to acquire and process the very weak electrical signals generated by plants (10–150 mV). The signal is first amplified and filtered by the INA128 instrumentation amplifier, then further conditioned using the LMC6484 operational amplifier and passive RC filters to reduce high-frequency noise.

Finally, the STM32F411CEU6 microcontroller performs the analog-to-digital conversion, processes the data, and transmits it to the PlantLeaf application for visualization and analysis.

Experiments

Voltage Experiments

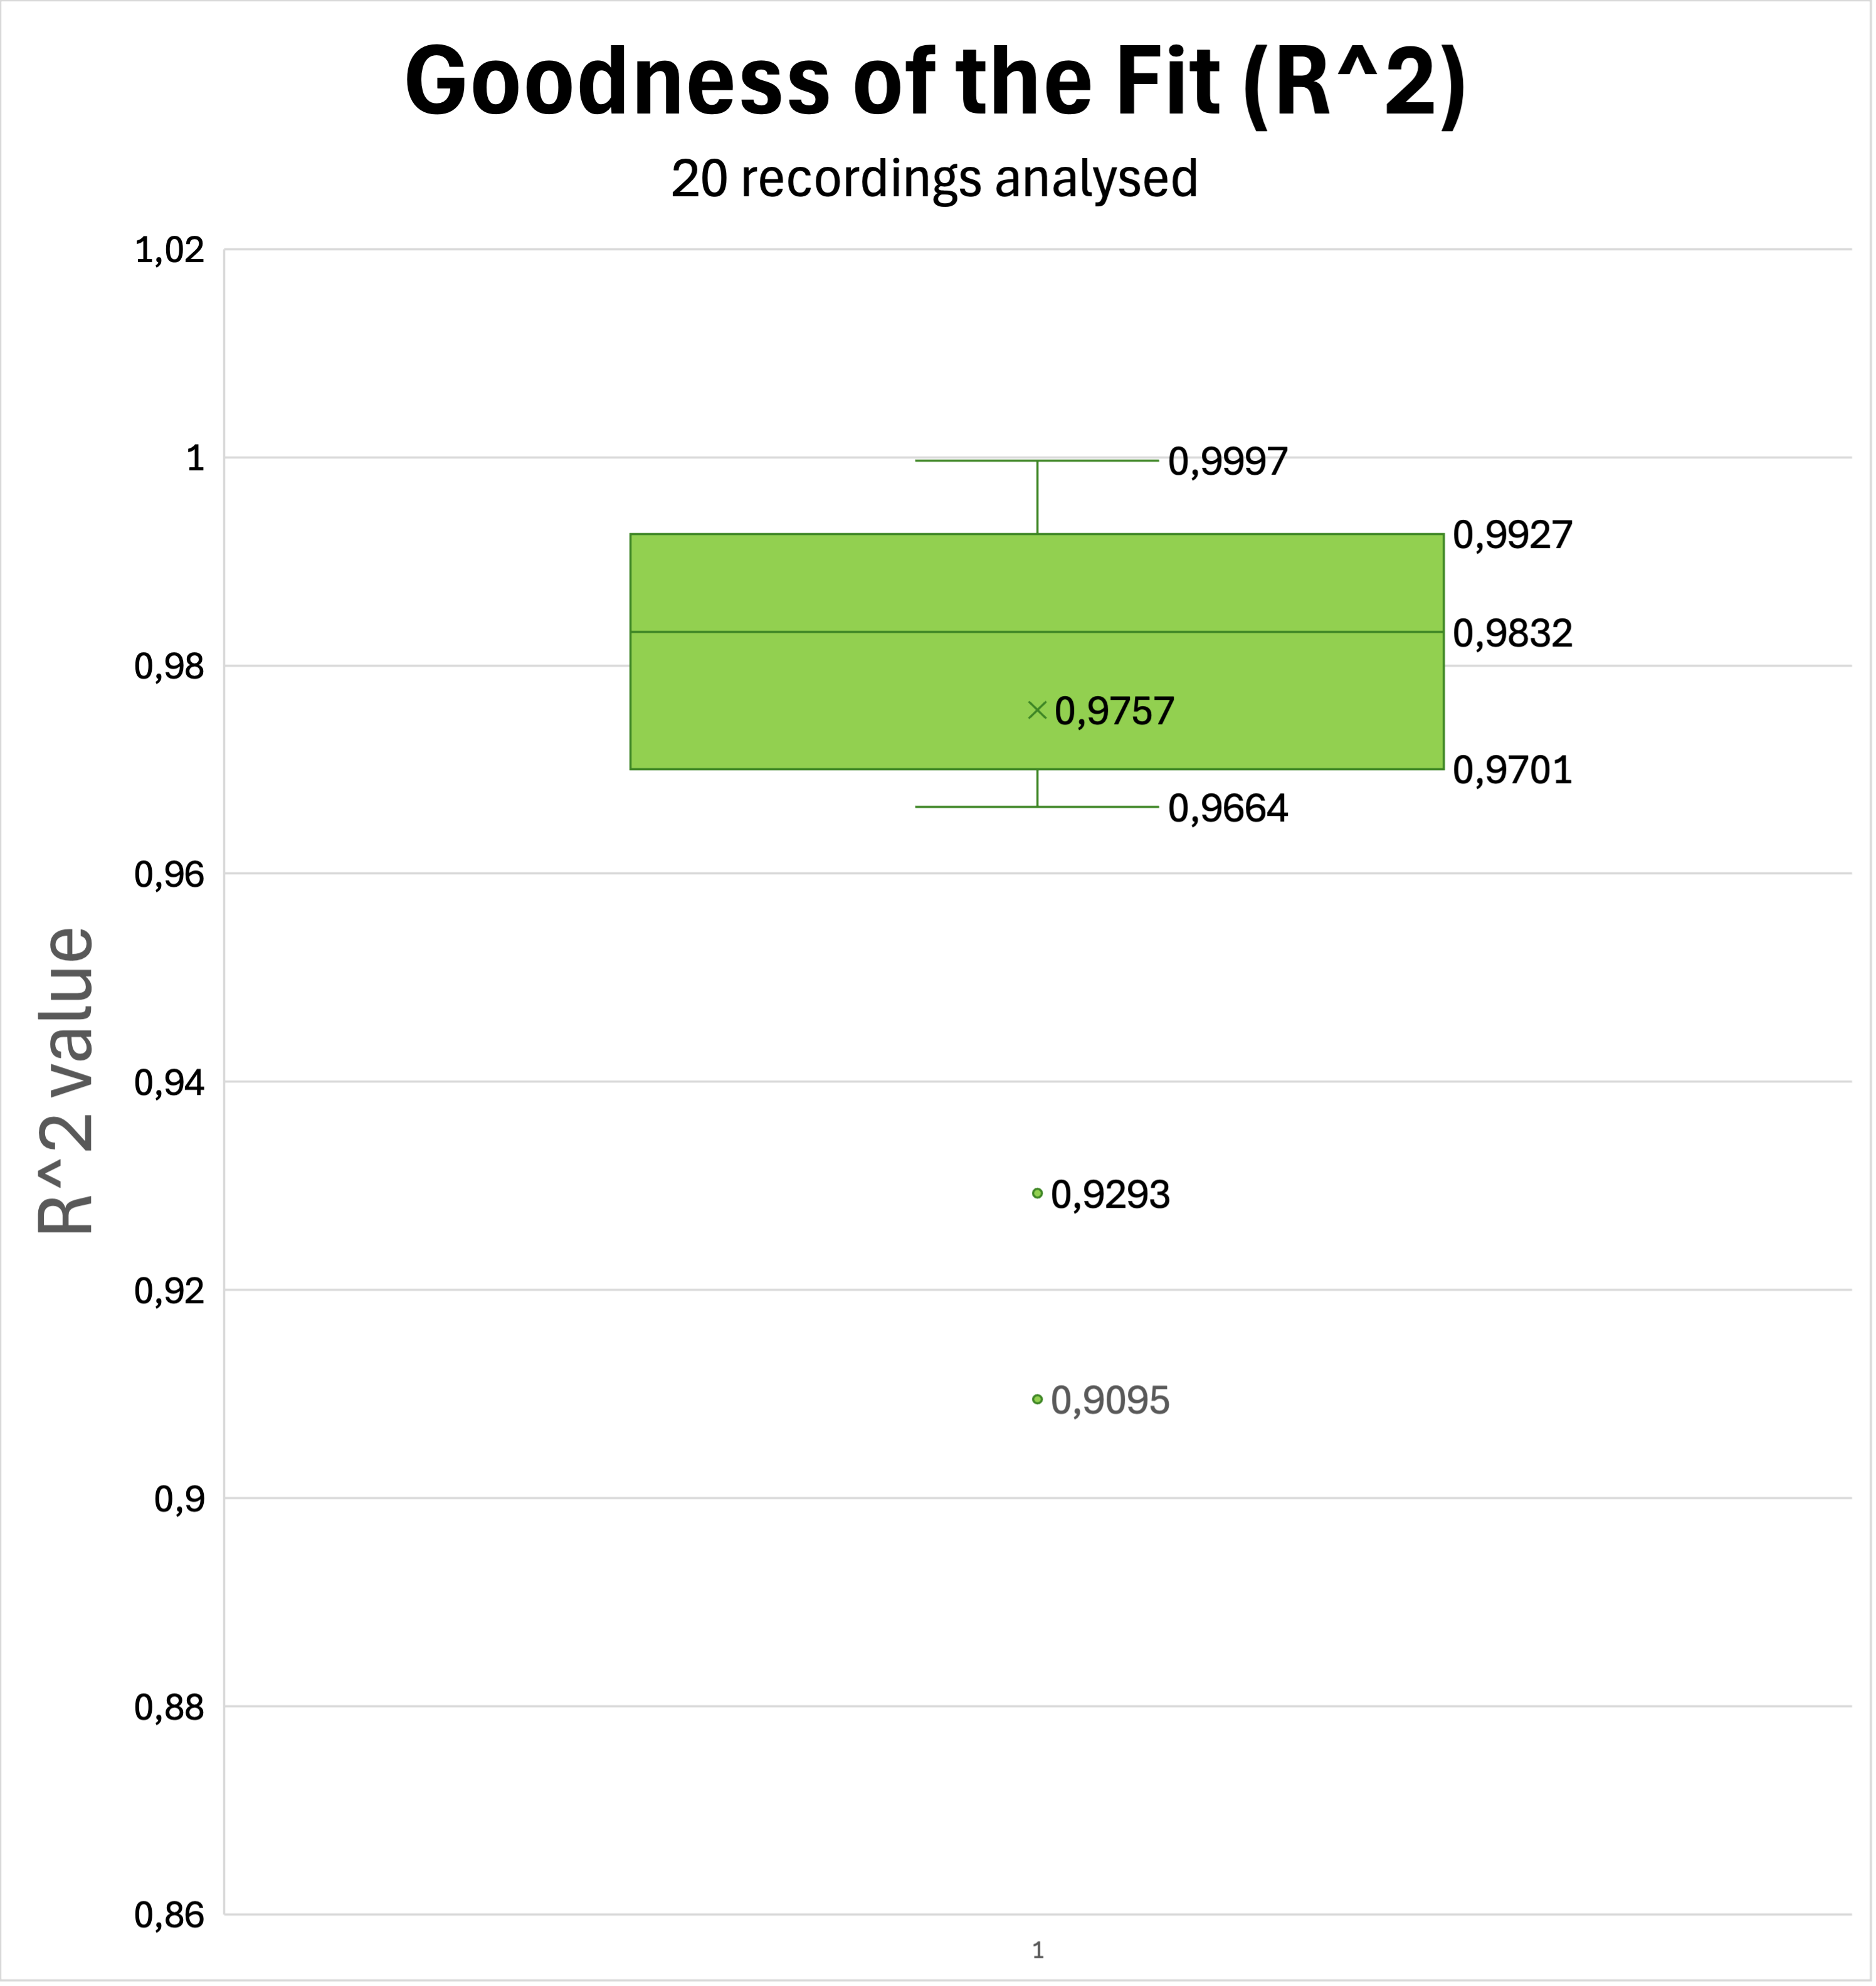
The experiments focused on capturing and analysing electrical signals generated by plants in response to different types of environmental stress. The plant chosen for initial tests was the Dionaea muscipula, selected for its particularly short reaction time to stimuli. Across 20 independently recorded responses, the models described above achieved a mean R² (Goodness of the Fit) of 0.9757 and a median of 0.9832 s, confirming strong agreement between the mathematical model and the observed physiology.

Analysis Boxplot

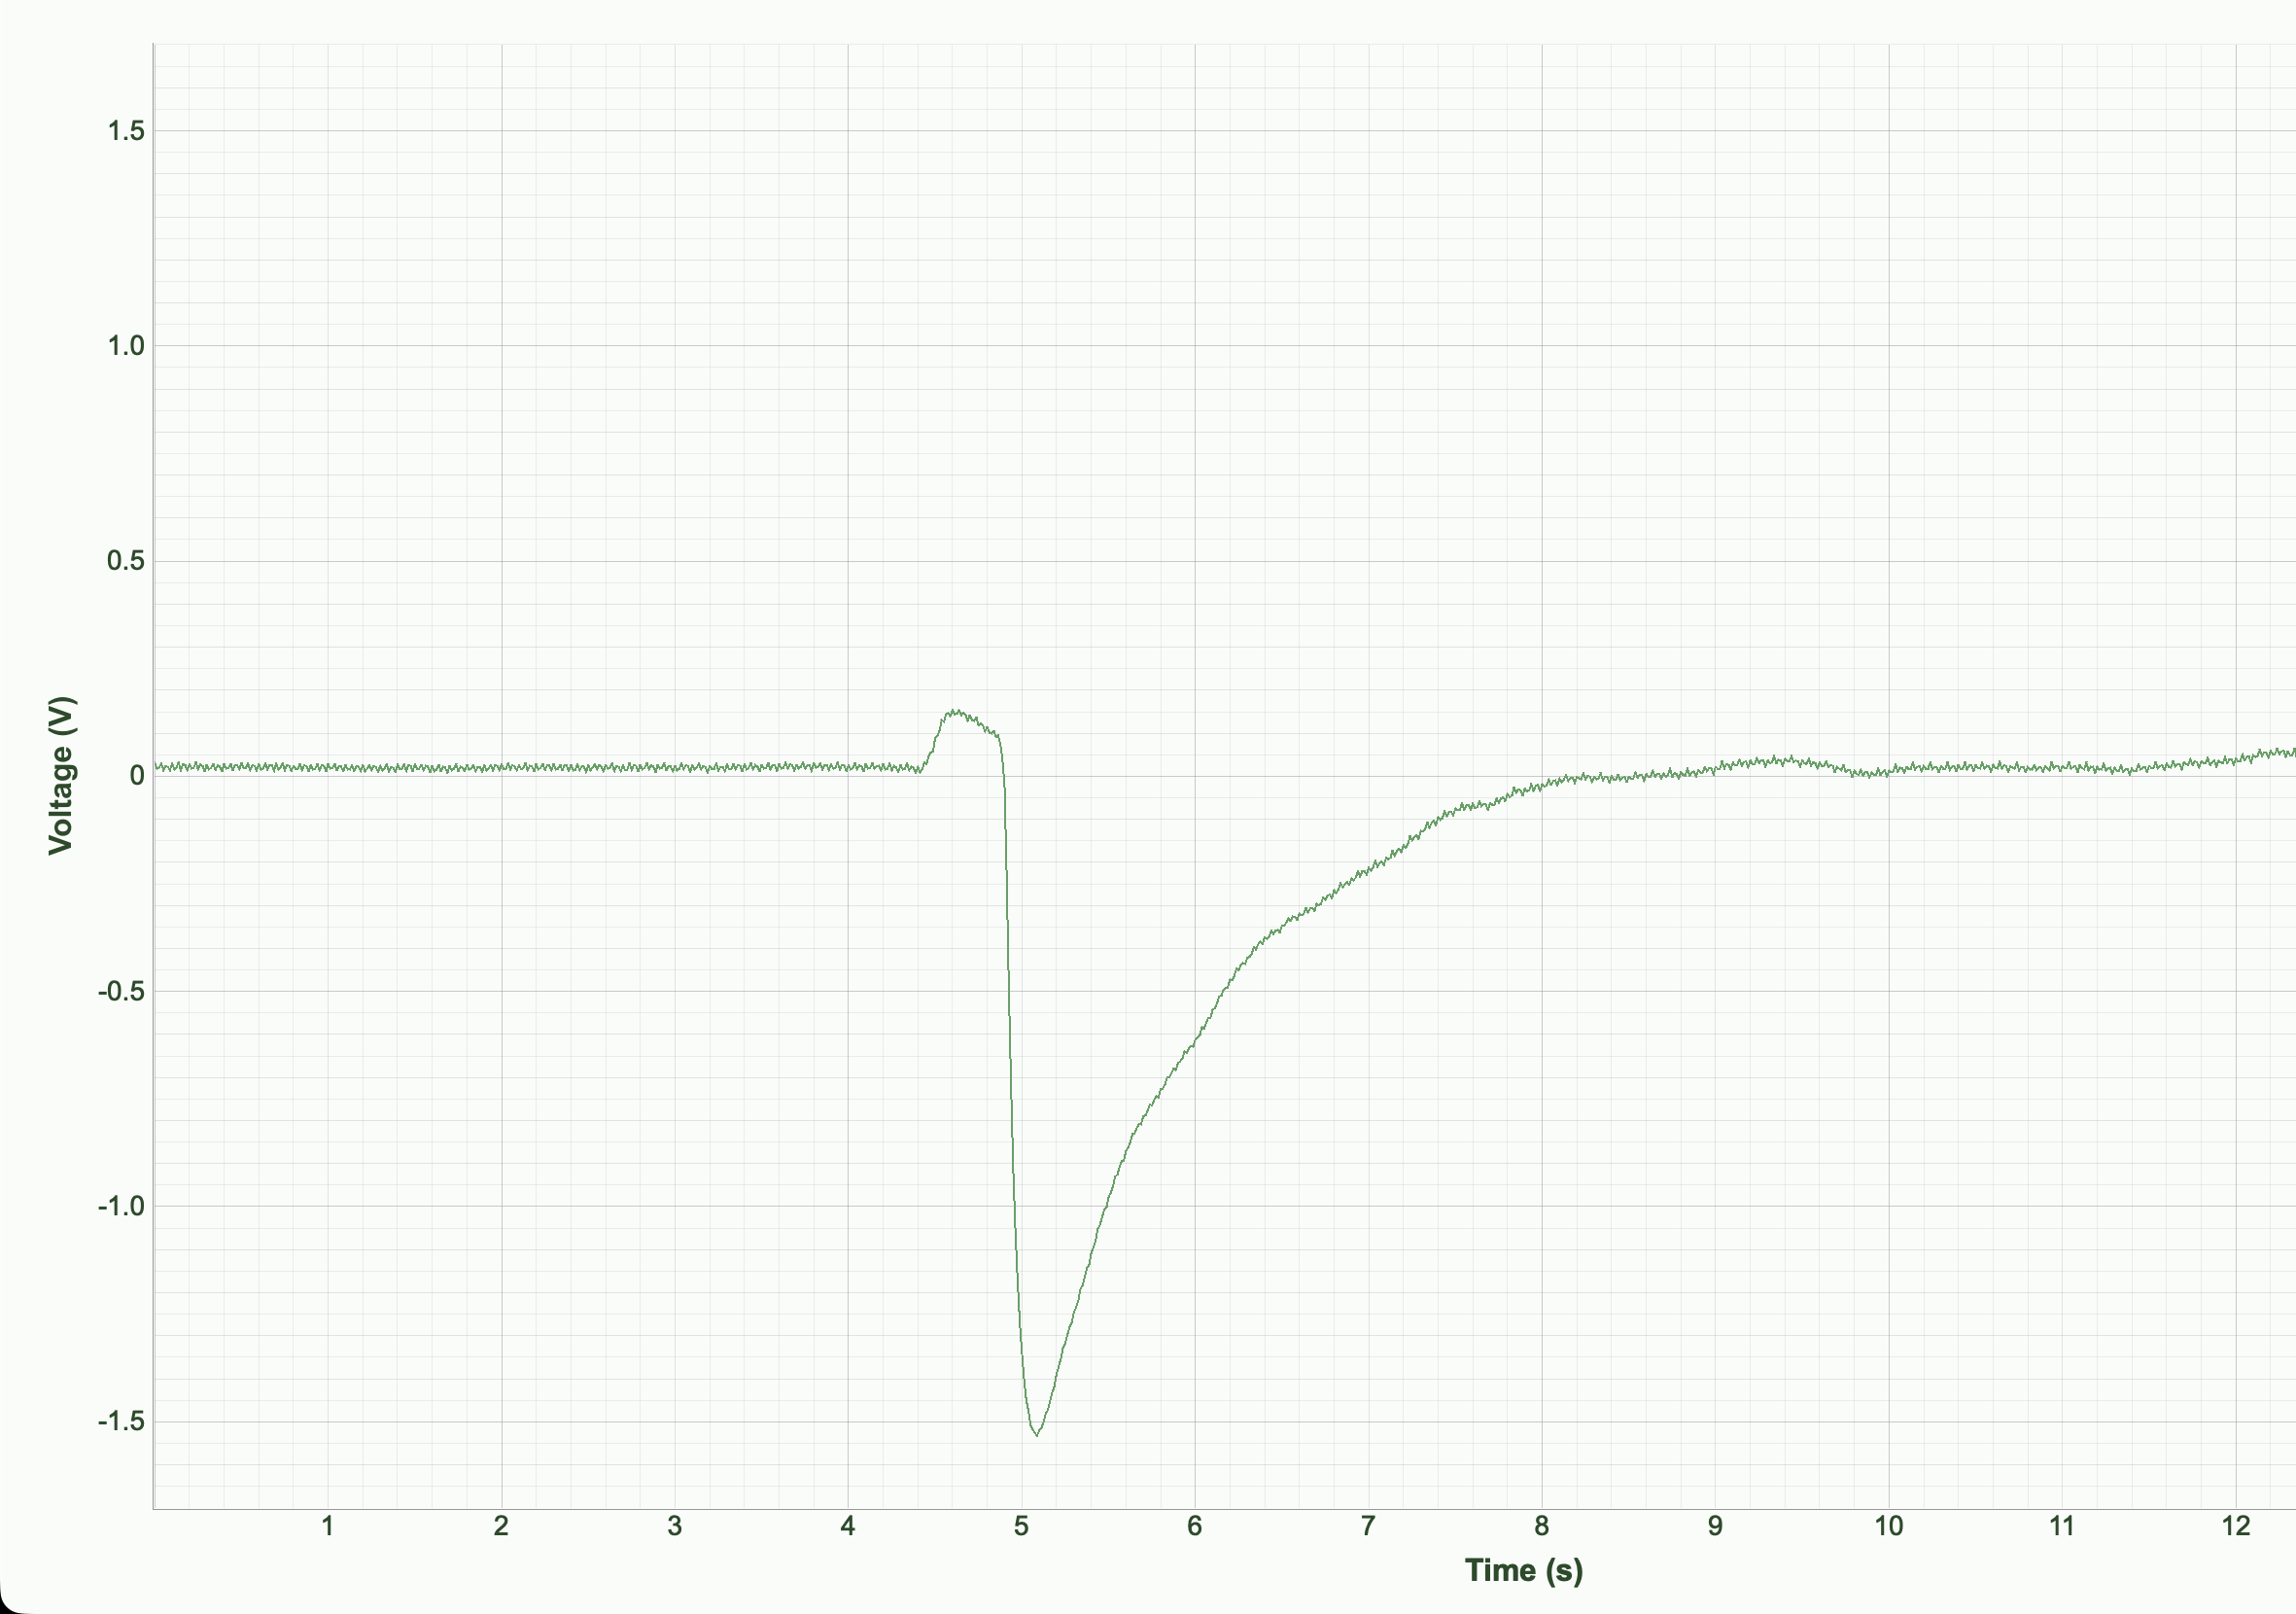
Mechanical stress

The obtained graphs show characteristic electrical responses: rapid depolarization followed by a slower repolarization phase, similar to action potentials described in scientific literature.

Cactus experiment

Mechanical stress n.1

Cactus mate experiment

Mechanical stress n.2

Aloe experiment

Mechanical stress n.3

Aloe mate experiment

Mechanical stress n.4

Light stress

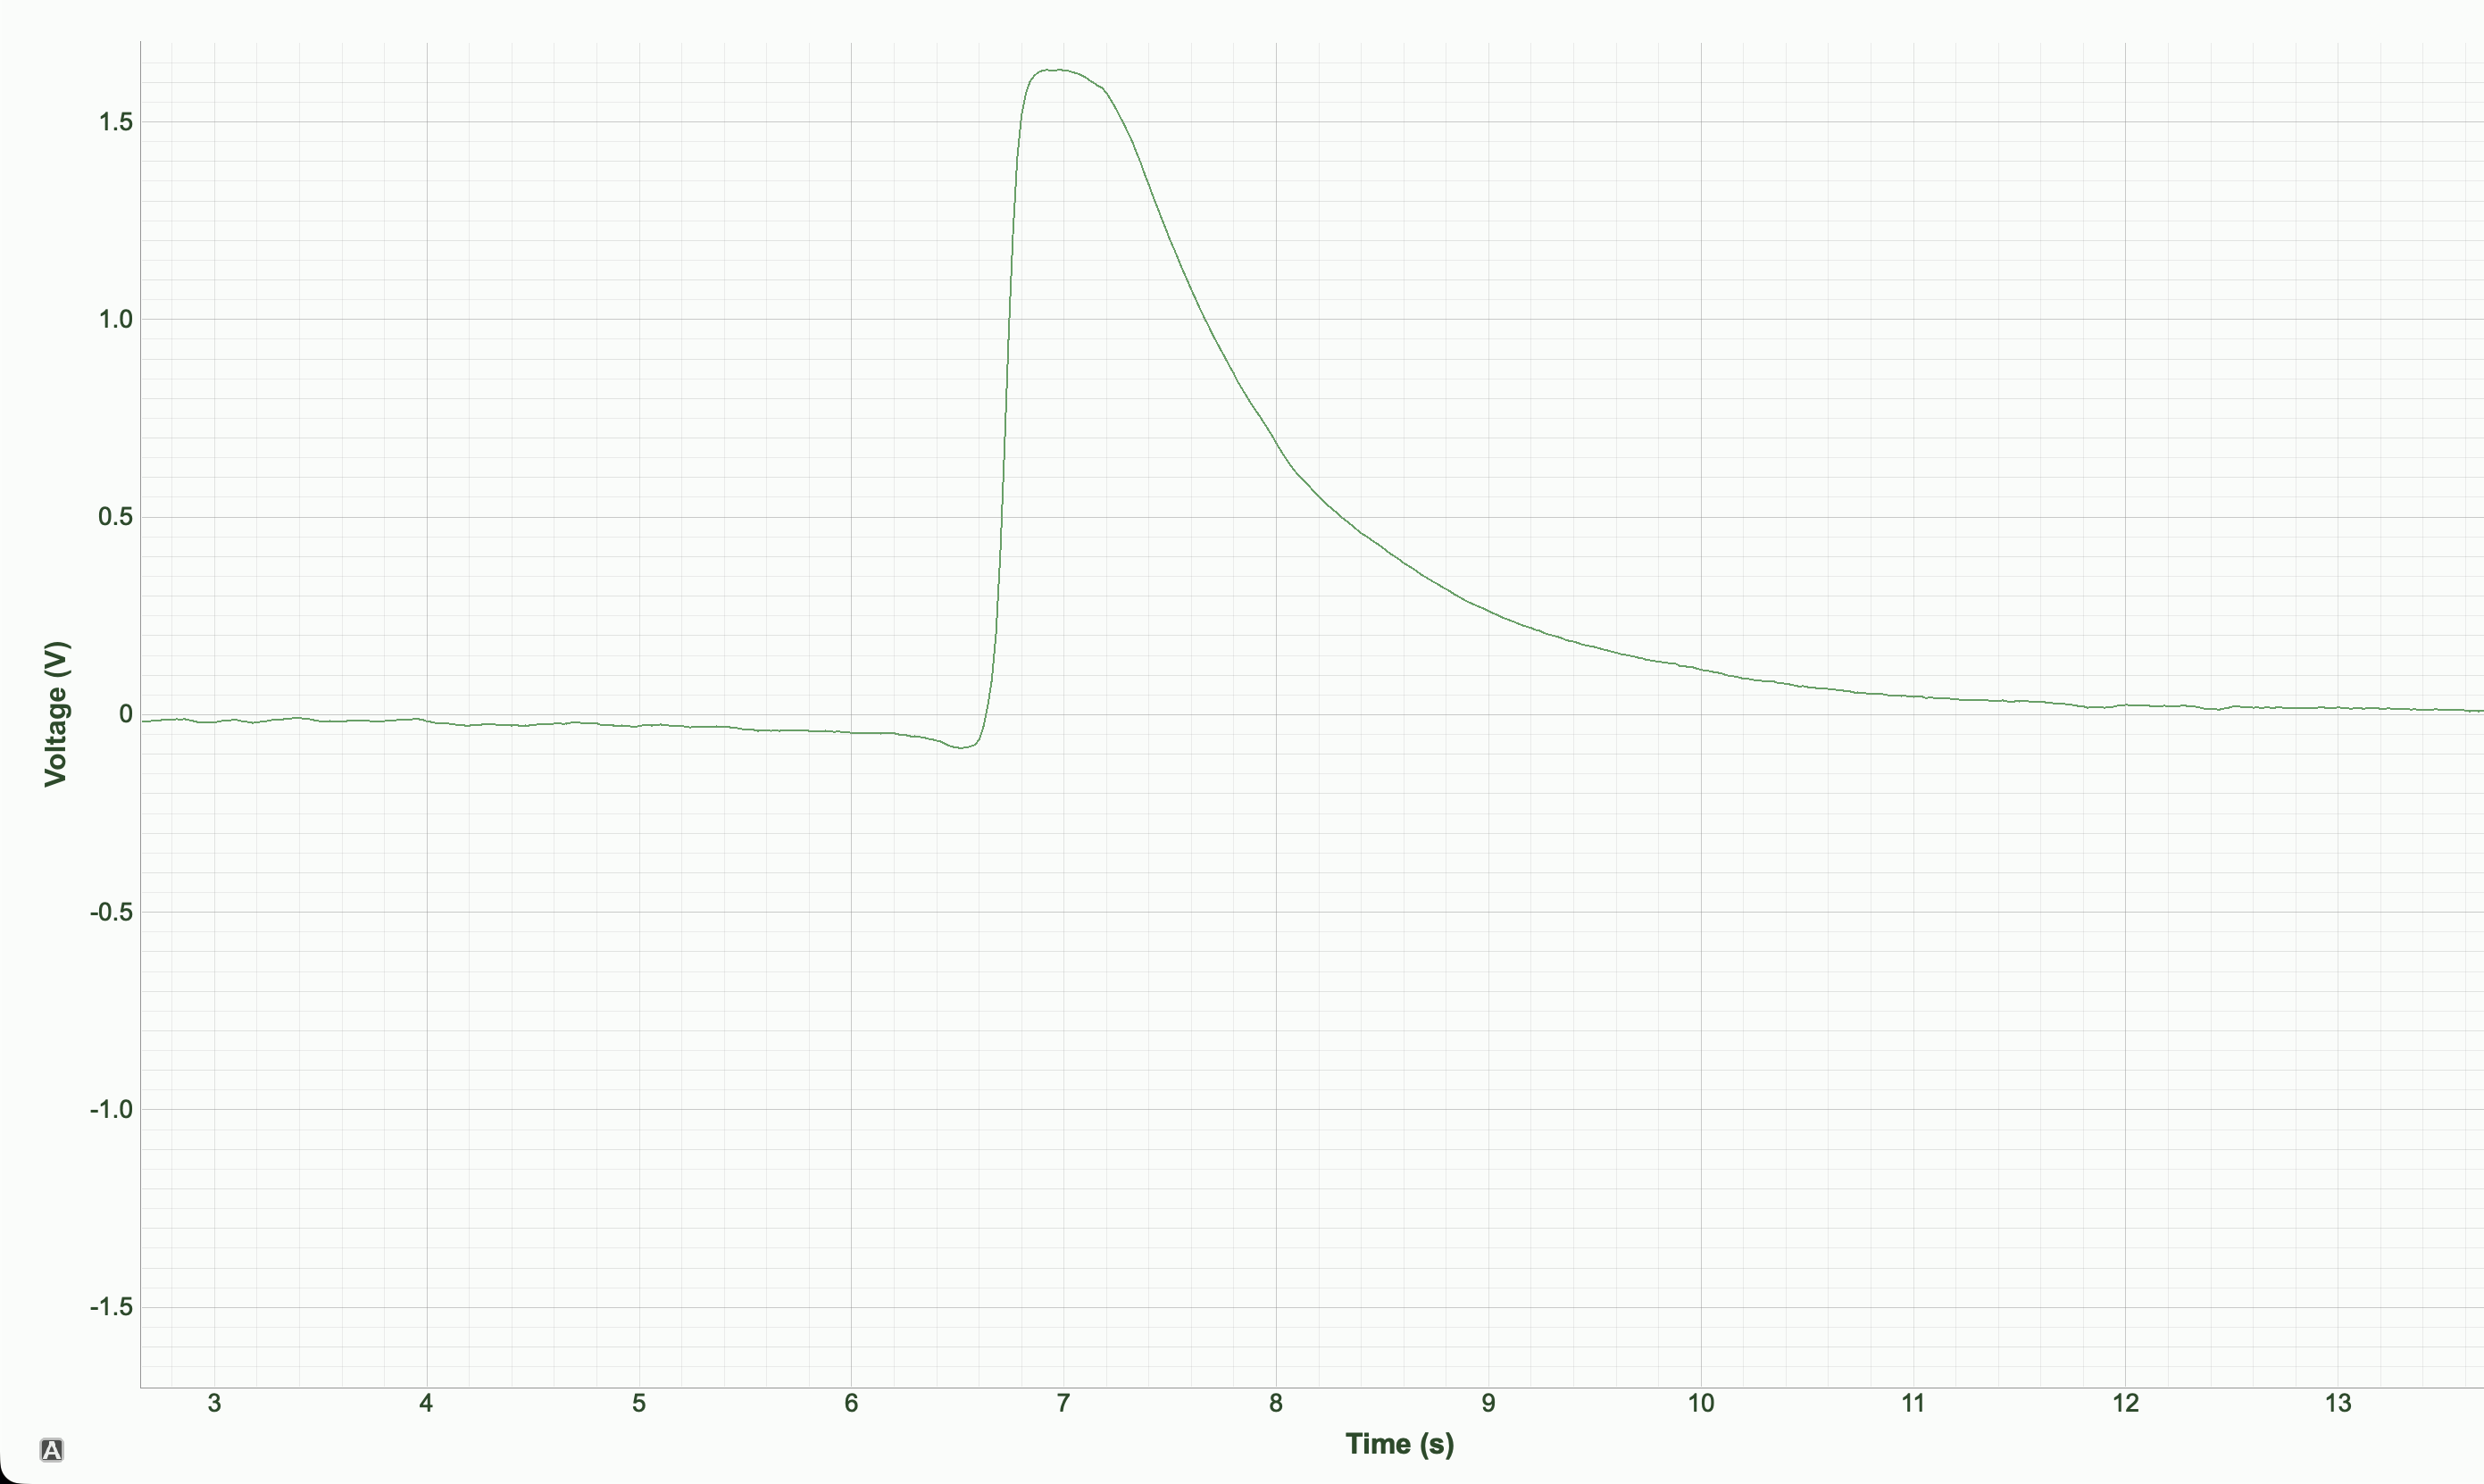
A second type of experiment investigated the plant's response to sudden exposure to intense light. The plant was initially placed inside a dome darkened with a black cloth. The sudden removal exposed the plant to strong light intensity, simulating a rapid transition from shade to direct sunlight. The recording showed a significant and rapid variation, with a depolarization peak followed by a gradual return to the baseline potential.

Cactus experiment

Light stress n.1

Cactus mate experiment

Light stress n.2

Aloe experiment

Light stress n.3

Aloe mate experiment

Light stress n.4