Detecting a click only tells us that the plant emitted one. Understanding where it comes from is a different problem entirely — and that is exactly the purpose of the Acoustic Simulator.
Plants transport water from the roots to the leaves through the xylem, a network of narrow conduits. The water inside is under negative pressure: it is pulled upward by transpiration from the leaves.
When a plant is under severe stress (for example, drought), this water column can break. A small air bubble forms inside the conduit, the water column separates, and that conduit stops functioning. This event is called embolism.
The rupture is not silent: it releases a short acoustic impulse at very high frequency (20–80 kHz, beyond human hearing) — this is the click that PlantLeaf's microphone records. The frequency of that sound, and how quickly it dies out (the decay time, called τ), carry information about what physically produced it.
The first hypothesis is that the click comes from an air bubble oscillating freely in the water inside the vessel. The bubble has an equilibrium radius, called \(R_0\), and this single value is enough to predict everything else: the frequency of the sound and how long it takes to fade out.
The oscillation loses energy through three independent physical mechanisms: the bubble radiates acoustic energy into the surrounding water, the water produces viscous friction, and heat is exchanged between the gas inside the bubble and the liquid around it. This last effect, heat exchange, turns out to be the dominant one in the frequency range relevant to PlantLeaf.
Main formulas
\[ \omega_0^2 = \frac{3\kappa \, p_{g0} - 2\sigma/R_0}{\rho \, R_0^2} \]
Resonance frequency of the bubble (Minnaert's theory, corrected with an effective polytropic exponent κ)
\[ \tau = \frac{1}{b_{rad} + b_{vis} + b_{th}} \]
Decay time τ, the sum of three damping effects (acoustic radiation + viscosity + heat exchange)
References: Minnaert, M. (1933), On musical air-bubbles and the sounds of running water, Philosophical Magazine · Plesset, M.S. & Prosperetti, A. (1977), Bubble dynamics and cavitation, Annual Review of Fluid Mechanics · Prosperetti, A. (1977), Journal of the Acoustical Society of America, 61:17 · Brennen, C.E. (1995), Cavitation and Bubble Dynamics, Oxford University Press.
The second, more recent hypothesis is different: it is not a bubble vibrating on its own, but the xylem vessel itself that resonates as a narrow tube of radius \(R\) and length \(L\). When the water column ruptures, the released energy sets the vessel into vibration, which then decays due to the viscosity of the sap inside it.
Unlike the bubble model, this model works in reverse: it starts from the measured click (frequency and τ) and derives the vessel's dimensions — two values that can then be compared with the plant's real anatomy observed under a microscope.
Main formulas
\[ f = \frac{m \cdot v_{eff}}{2L} \]
Resonance frequency of the vessel, treated as a tube of length L
\[ R = \sqrt{\frac{4 \, \eta_l \, \tau_s}{\rho_l}} \]
Vessel radius, derived from the decay time τ measured on the real click
Reference: Dutta, S. et al. (2022), Ultrasound Pulse Emission Spectroscopy Method to Characterize Xylem Conduits in Plant Stems, Research, 2022:9790438, DOI: 10.34133/2022/9790438.
The two models are not two versions of the same idea — they describe two different physical mechanisms, with different roles.
Both models are tested on every single click, using the exact same measurement procedure. Comparing their results — rather than trusting either model alone — shows which physical mechanism most plausibly explains what happened inside the plant.
142 hand-labelled clicks, 291 non-click events from the same sessions as a null comparison. Neither model comes out unscathed.
Our clicks ring 2.45× longer than physics allows at their frequency — quality factor around 26 against a physical ceiling of 9 to 14. The size doesn't fit either: a bubble at that frequency would be too large for the plant's vessels.
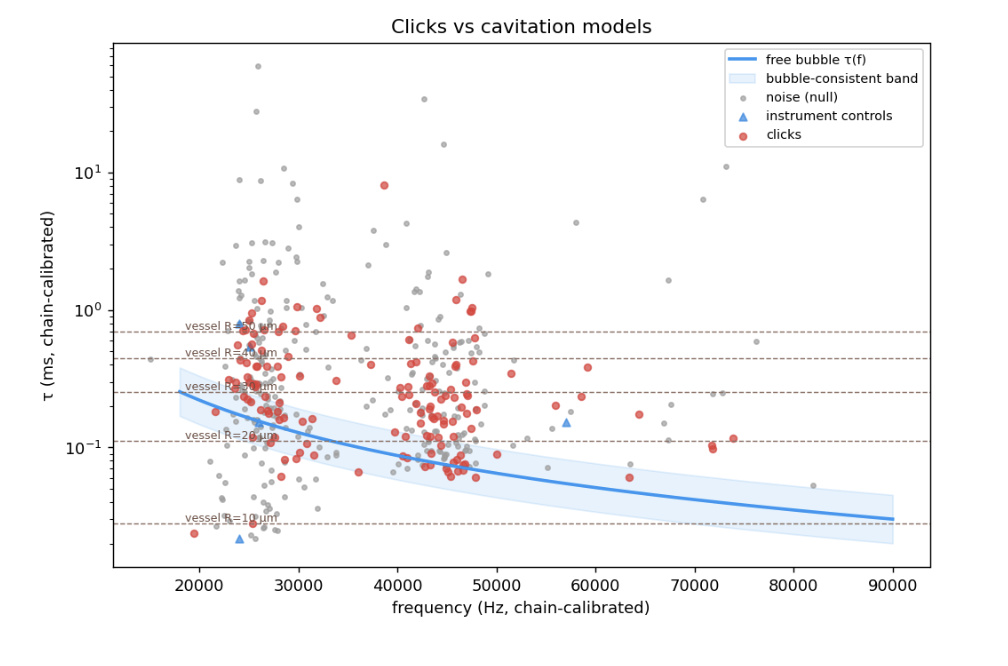
Each click plotted by frequency and decay time (τ), against the free-bubble prediction (blue curve and band) and the noise events (grey)
Duration, quality factor, and model fit are statistically identical between real clicks and background noise recorded in the same sessions. The damped-sine shape often cited as evidence of cavitation looks like a property of the measurement chain, not the source.
| clicks | noise | p | |
| duration (ms) | 0.232 | 0.251 | 0.18 |
| quality factor Q | 26 | 24.5 | 0.39 |
| fit to vessel model | 0.50 | 0.54 | 0.45 |
| fit to bubble model | 0.50 | 0.51 | 0.52 |
Clicks sit at a higher frequency than noise (41 kHz vs. 30 kHz), though the gap alone can't reliably separate the two groups. The difference doesn't come from the microphone: clicks fall less often right at the microphone's own resonance than noise does.
the vessel model
Applied to our clicks, the model gives numbers close to those published by Dutta et al. for other species — but we've never examined our plants' vessels under a microscope, so we can't confirm they reflect reality. More importantly, given any click, even random noise, the model always returns a plausible-looking vessel: there's no frequency-duration pair it would reject as impossible. A reasonable number is not evidence on its own — the model simply never fails.
| our clicks | Dutta et al. | |
| acoustic radius | 28.8 µm | 10.7–22.8 µm |
| vessel length | 0.81 mm | 0.64–1.59 mm |
None of this disproves cavitation as the event behind the click — it disproves two specific acoustic descriptions of that event. The free bubble is ruled out; the vessel resonance model remains our best working hypothesis, pending anatomical verification.
It is not enough to compute the theoretical sound produced by a bubble or a vessel and compare it directly with a recorded click: before reaching the microphone, every real click goes through several processing steps — the microphone itself, how the firmware digitizes it, and how the signal is reconstructed afterward.
To make a fair comparison, the simulator passes the simulated signal through exactly the same steps that the real signal went through — the same processing chain, the same measurement standard. Only then can the two clicks be compared honestly.
The simulator then tries different combinations of parameters (such as the bubble radius, or the vessel's geometry) until the simulated click resembles the real one as closely as possible — a process called calibration. The result is a similarity score between the two waveforms, showing how well each model explains that particular click.
For every recorded click, the simulator shows side by side which of the two models — free bubble or vessel resonance — explains it better, with a plot overlaying the real click and the simulated one.
Each model's parameters are automatically adjusted until the simulated click best reproduces the real one, returning quantities such as the bubble radius or the vessel's dimensions.
By analysing many clicks together, the simulator can estimate xylem water tension — a biological parameter impossible to measure directly — simply from the recorded sound.
All results from an entire recording can be exported as a CSV file for external statistical analysis, or collected into a PDF report with plots and tables, ready to share.
The Acoustic Simulator does not replace the click-detection algorithm — it interprets what the algorithm finds. It turns a single ultrasonic recording into a concrete estimate of what is actually happening inside the plant's vascular system.